Content
Published:
This is an archived release.
Many with supplementary industries
More than half of the agricultural holdings performed other gainful activities such as machinery-related services, in addition to ordinary farming. Work input to these activities amounted to 6.1 million man-hours in 2012/2013.
| 2010 | 2013 | Change in per cent 2010-2013 | |
|---|---|---|---|
| Agricultural holdings, number | 46 624 | 43 726 | -6.2 |
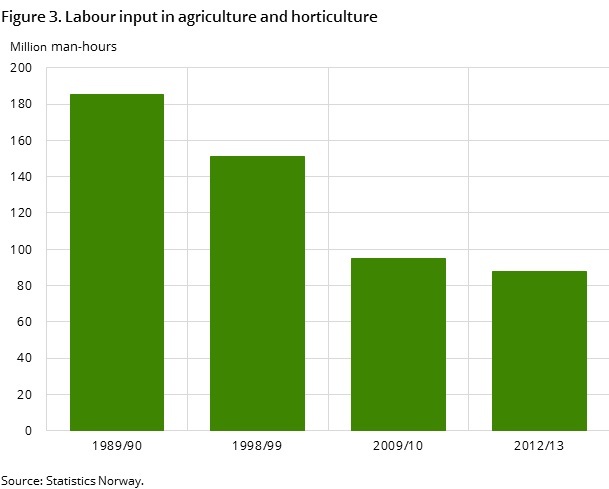
| Labour input, 1000 man-hours | 94 538 | 88 145 | -6.8 |
| Average labour input per holding, man-hours/holding | 2 028 | 2 016 | -0.6 |


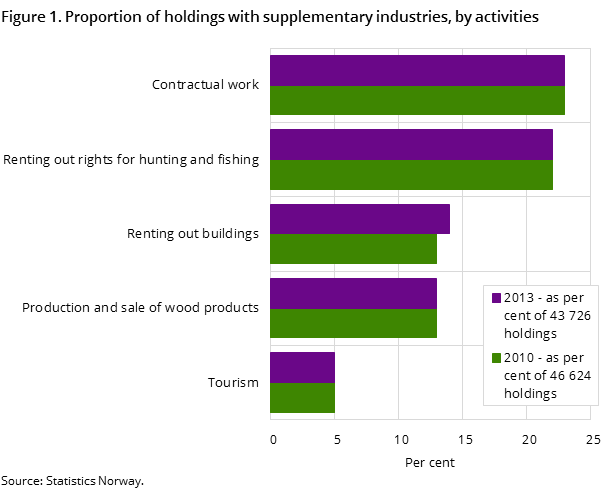
In 2012/2013, 55 per cent of the agricultural holdings were engaged in at least one form of supplementary industry besides traditional farming. The most common supplementary activity was machinery-related services, which was carried out by around 9 900 holdings. Labour input to such activities was calculated to 6.1 million man-hours out of a total of 96.6 million man-hours performed on all holdings.
Many of the activities falling under the definition of supplementary industry require little or no work input, such as renting out hunting and fishing rights, buildings or agricultural land. Many holdings are engaged in these activities, but this does not affect the total labour input to any great extent.
In this context, supplementary industry refers to an activity that uses land, buildings or machinery belonging to the holding.
Decrease in labour input
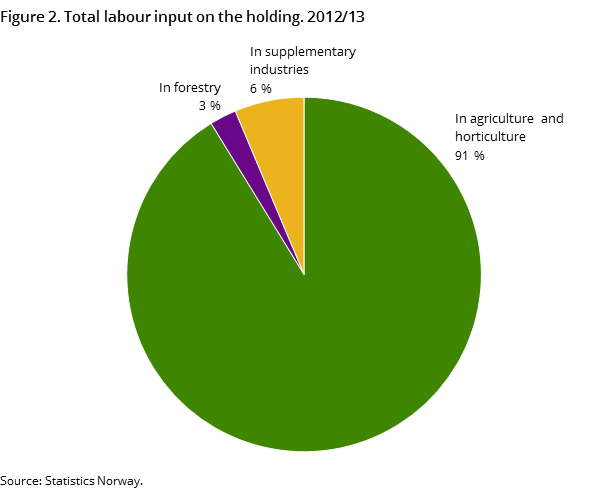
The total labour input on agricultural holdings in the period 1 March 2012–28 February 2013 amounted to 96.6 million man-hours, of which agriculture and horticulture represented 88.1 million, forestry 2.4 million and supplementary industries 6.1 million man-hours. The average labour input in agriculture and horticulture per holding was 2 016 man-hours. Final figures for labour input in agriculture and horticulture are quite similar to the preliminary statistics.
2.3 tractors per holding
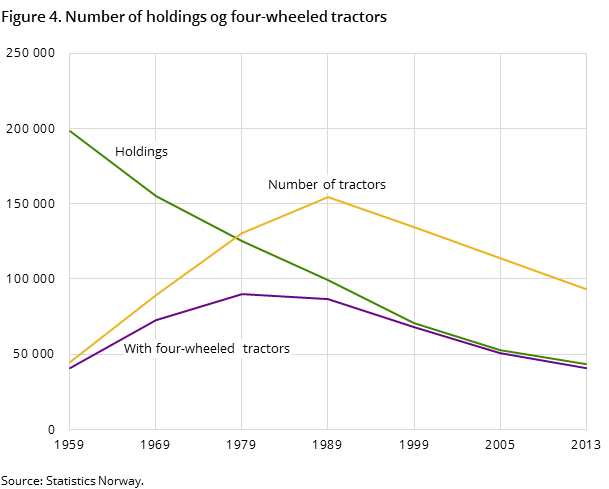
Norwegian farmers had 93 100 four-wheeled tractors at their disposal in 2013, compared to 114 100 in 2005. On average, each holding had 2.3 four-wheeled tractors in 2013, compared to 2.2 in 2005 and 2.0 in 1999.
Smaller irrigable area
In 2013, 14 per cent of the holdings had irrigation installations, a decrease of 4 percentage points since 1999. Irrigable land comprised 897 500 decares, or 9 per cent of the area in use, in 2013. The corresponding figure for 1999 was 1 344 000 decares, or 13 per cent. In 2012, only 195 300 decares of agricultural land were actually irrigated at least once during the growing season.
Contact
-
Berit Bjørlo
E-mail: berit.bjorlo@ssb.no
tel.: (+47) 40 81 13 76
-
Cathrine Gran Øverby
E-mail: cathrine.overby@ssb.no
tel.: (+47) 40 85 46 03
