Content
Published:
This is an archived release.
Increased investments in farm buildings
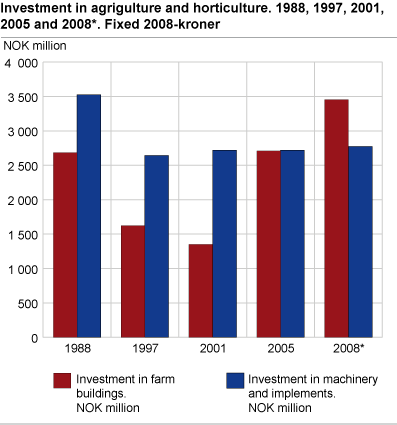
The investments in farm buildings for agriculture and horticulture amounted to NOK 3.5 billion in 2008. Measured in fixed 2008-NOK, the corresponding figure in 2005 was NOK 2.7 billion.
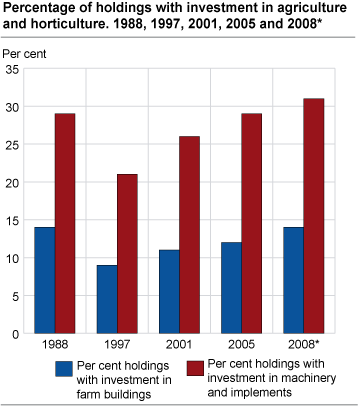
About 15 per cent of the holdings invested in farm buildings in 2008. Corresponding figures for 2005 and 2001 were 12 and 11 per cent, respectively. Converted to 2008NOK by the Consumer Price Index, the average investment per holding with investment were NOK 502 300 in 2008, NOK 424 500 in 2005 and NOK 198 500 in 2001. The holders operating the smallest and the largest agricultural area made the largest investments. Joint operations with milk production are among holdings with 0-49 decare of agricultural area in use. The joint operations that made investments, had an average investment of NOK 1.5 million in 2008.
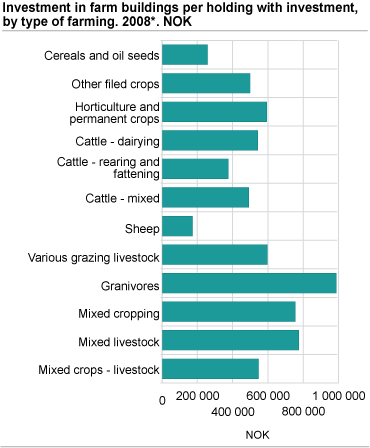
Holdings with dairy production represented 27 per cent of the total investments in farm buildings in 2008. Farms with pig and poultry as main production had the largest investments per holding, NOK 987 000, while farms with sheep and farms with cereals and oil seed had the smallest average investments.
About 85 per cent of the holdings had maintenance expenditures on the farm buildings in 2008. The total maintenance expenditures made up to NOK 1.1 billion, which corresponds to NOK 28 300 per holding with maintenance.
Increased percentage of holdings with investments in machinery and implements
Investments in machinery and implements for agriculture and horticulture amounted to NOK 2.8 billion in 2008. About 30 per cent of the holdings invested in new or second-hand machinery and implements. Corresponding figures for 2005 and 2001 were 29 and 26 per cent, respectively. Average investments per holding with investments in 2008 were NOK 186 000.
Leasing of machinery made about NOK 657 million in 2008. The holdings with leasing contracts paid in average NOK 91 900 in leasing fee in 2008, against NOK 82 100 in 2005.
Higher energy consumption per holding
The total consumption of electricity in agriculture and horticulture fell from 1.14 billion kWh in 2005 to 1.11 billion kWh in 2008. The average consumption per holding increased by 2 000 kWh to 26 000 kWh.
The consumption of diesel per holding increased from 2 700 litres per holding in 2005 to 3 000 litres in 2008. The energy consumption is not adjusted for holdings with lack of information, and energy consumption in greenhouses is not included in the figures.
Tables:
- Table 1 Holdings with investment in farm buildings. 1988, 1997, 2001, 2005 and 2008*
- Table 2 Investment in farm buildings. 1988, 1997, 2001, 2005 and 2008*. Fixed 2008-kroner
- Table 3 Holdings with investment in farm buildings, by type of farming. 2008*
- Table 4 Maintenance of farm buildings. 2001, 2005 and 2008*. Fixed 2008-kroner
- Table 5 Holdings with investment in machinery and implements for agriculture and horticulture. 1988, 1997, 2001, 2005 and 2008*
- Table 6 Investment in machinery and implements for agriculture and horticulture. 1988, 1997, 2001, 2005 and 2008*. Fixed 2008-kroner
- Table 7 Consumption of electricity in agriculture. Excl. Greenhouses. 2001, 2005 and 2008*
- Table 8 Consumption of diesel in agriculture. Excl. Greenhouses. 2001, 2005 and 2008*
Contact
-
Berit Bjørlo
E-mail: berit.bjorlo@ssb.no
tel.: (+47) 40 81 13 76
-
Cathrine Gran Øverby
E-mail: cathrine.overby@ssb.no
tel.: (+47) 40 85 46 03


