Content
Published:
NOK 4.4 billion in film and video in 2007
Businesses within motion picture and video had a combined turnover of NOK 4.4 billion in 2007. This was an increase of 11.8 per cent from the previous year. However, the growth was somewhat lower than from 2005-2006.
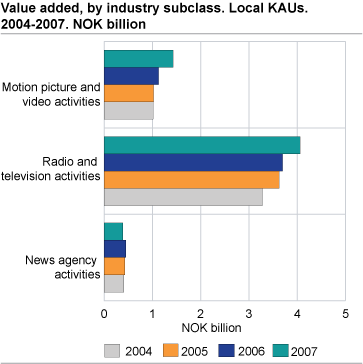
The industry group motion picture and video consists of motion picture and video production, motion picture and video distribution, and motion picture projection. Motion picture and video production was the largest of the three, with 1 821 employees and a turnover of NOK 2.1 billion. Employment increased 19.4 per cent from 2006, turnover 19.9 per cent. The operating result was NOK 193 million, about the same as the previous three years. The operating margin has been higher before; in 2007 it was 8.6 per cent. Value added per employee came to NOK 425 000.
Radio and TV had a turnover of NOK 9 billion
Turnover in radio and television activities was up 6.1 per cent from 2006, ending at NOK 9 billion.
A total of 6 240 employees in 363 businesses added value of over NOK 4 billion. Operating costs rose 8.9 per cent and were, for the first time since 2002, equal to the operating income.
Statistics on the enterprise level
The structural business statistics for cultural services are compiled both on the local KAU level and on the enterprise level. On the enterprise level the development in turnover and employment was about the same as on the business level. Enterprises within cultural services employed 10 210 and had a combined turnover of NOK 14.9 billion.
Statistics on the enterprise levelThe structural business statistics for cultural services are compiled both on the local KAU level and on the enterprise level. Figures on the enterprise level will usually deviate from figures on the local KAU level. This is due to the fact that the enterprises are registered in the industry subclass that comprises the main part of the activity of the enterprise, and therefore may be registered in a different industry than some of the local KAUs. Revision of industriesIn 2007 and 2008, the enterprises in Statistics Norway’s Central Register of Establishments and Enterprises were coded in accordance with the new Standard Industrial Classification (SN2007). This has revealed some incorrectly classified enterprises and local KAUs. In such cases, the code according to the current standard (SN2002) has been revised. Transfers of enterprises have led to figures for News agencies activities for 2007 that are not directly comparable to previous years. The new Standard Industrial Classification (SN2007) will be used for the first time in the publishing of preliminary figures for the statistical year of 2008, in October 2009. Descriptions of the classifications are available here . |
Tables:
- Table 1 Cultural services. Principal figures, by industry subclass. Local kind-of-activity units. 2004-2007
- Table 2 Cultural services. Principal figures, by number of persons employed and industry group. Local kind-of-activity units. 2007
- Table 3 Cultural services (NACE 92.1). by county. Local kind-of-activity units. 2006 and 2007
- Table 4 Cultural services (NACE 92.2). Principal figures, by county. Local kind-of-activity units. 2006 and 2007
- Table 5 Cultural services (NACE 92.4). Principal figures, by county. Local kind-of-activity units. 2006 and 2007
- Table 6 Cultural services. Principal figures, by industry subclass. Enterprises. 2004-2007
- Table 7 Cultural services. Principal figures, by number of persons employed and industry group. Enterprises. 2007
The statistics is now published as Business statistics.
Contact
-
Statistics Norway's Information Centre
E-mail: informasjon@ssb.no
tel.: (+47) 21 09 46 42


