Content
Published:
This is an archived release.
Debt to income ratio increases
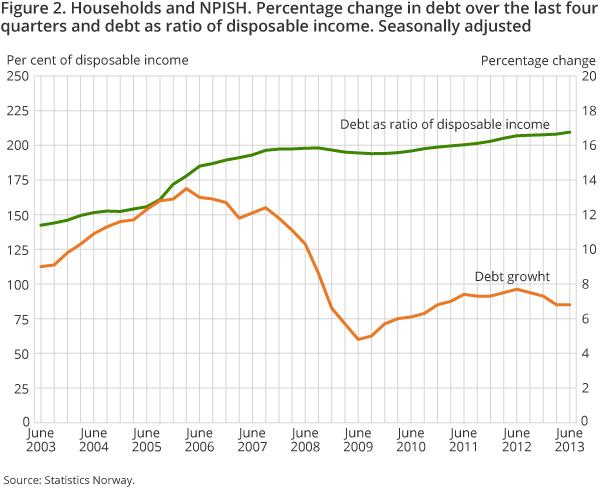
Households’ debt continued to increase faster than income. The seasonally-adjusted debt to income ratio increased by 1.4 percentage points in the second quarter of 2013 and is estimated at 209.5 per cent of disposable income at the end of the quarter.
| Non financial corp. etc. | Financial corporations | General government | Households and NPISH | Rest of the world | |
|---|---|---|---|---|---|
| 2nd quarter 2013 | |||||
| Net financial assets, start of period | -2 726 457 | 361 384 | 5 245 318 | 491 894 | -3 372 139 |
| Net lending | -37 577 | 583 | 141 676 | -15 035 | -89 647 |
| Other changes | 59 916 | 11 553 | 70 481 | -8 337 | -133 613 |
| Net financial assets, end of period | -2 704 118 | 373 521 | 5 457 474 | 468 522 | -3 595 399 |
| 3rd quarter 2012 - 2nd quarter 2013 | |||||
| Net lending (sum) | -26 355 | 41 040 | 355 482 | 460 | -370 626 |
| Other changes (sum) | -144 236 | -20 576 | 464 488 | 40 271 | -339 948 |
| Growth in debt (per cent) | 2.9 | 1.3 | 11.2 | 6.8 | 6.5 |


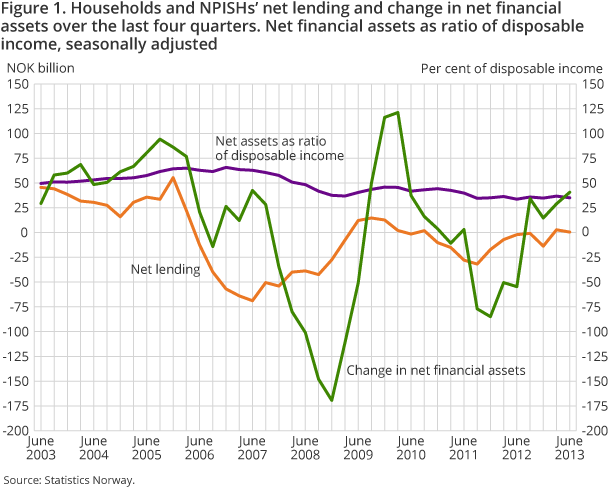
Households and non-profit institutions serving households’ net lending was NOK 0.5 billion, summarised over the four last quarters to the second quarter of 2013. This is NOK 2 billion lower than in the previous four-quarter period. The development is explained by a moderate increase in borrowing, net sales of securities and decreasing growth in bank deposits in the last four-quarter period.
Debt growth levels off
Borrowing is calculated to NOK 175 billion, which is an increase of NOK 3 billion from the previous four-quarter period. Households` debt is composed of two instruments; loans and other accounts payable. Debt growth is mostly influenced by loans from the financial corporations, but borrowing from this corporations fell by NOK 2 billion to NOK 148 billion at the end of the last four-quarter period. On the other hand, households’ borrowing from other institutional sectors increased by NOK 3 billion. Other accounts payable also increased by NOK 2 billion in the four-quarter period to the end of the second quarter of 2013.
The estimated annual growth rate for households` debt flattened out in the second quarter of 2013 and the seasonally-adjusted growth rate was calculated to 6.8 per cent, which is the same growth rate as in the previous quarter. The growth rate peaked at the end of the second quarter of 2012, and has gradually fallen during the last four quarters. In the second quarter of 2013, the growth in loans was calculated to 7.3 per cent, while the growth in other accounts payable was estimated at 0.7 per cent.
Net financial assets fell
Households` net financial assets fell by NOK 23 billion in the second quarter of 2013. Net financial assets amounted to NOK 469 billion at the end of the quarter and the seasonally-adjusted net financial assets to income ratio fell by 1.7 percentage points to 35.1 per cent of disposable income. Households had to take a net loss of more than NOK 8 billion in the second quarter of 2013, while net lending was NOK -15 billion.
Banks and mortgage companies increased their net borrowing abroad
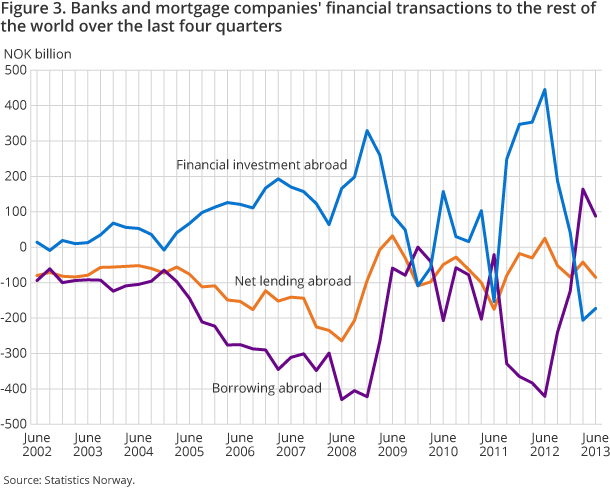
Banks and mortgage companies have net debt to the rest of world. These financial corporations sold foreign financial assets for NOK 173 billion during the four-quarter period to the second quarter of 2013, while their debt abroad was only paid down by NOK 88 billion. Net transactions in the rest of the world contributed to net debt abroad of NOK 85 billion in the four-quarter period. If we add the effect of net holding gains due to exchange rate developments in foreign exchange and global security markets, banks and mortgage companies’ net debts abroad increased by NOK 88 billion to NOK 1 271 billion at the end of the second quarter of 2013.
There are large volatilities in the quarterly transactions between the domestic banks and mortgage companies on the one side and the rest of the world on the other side. Fluctuations are largely due to bank deposits. Domestic banks are in a net debt position to the rest of the world in this financial instrument. At the end of the second quarter of 2013, domestic banks’ foreign deposits amounted to NOK 413 billion, while foreign banks’ deposits in Norway were NOK 911 billion. However, domestic banks increased their foreign deposits by NOK 68 billion in the second quarter of 2013 and this is more than the deposits from abroad, which only increased by NOK 38 billion.
Hugh holding gains for the state
The central government’s net holding gains are calculated to NOK 453 billion in the four-quarter period to the end of the second quarter of 2013. Net holding gains to the rest of the world explain the development and amounted to NOK 458 billion. The major holding gains are due to the exchange rate development and increased market prices in the foreign shares held by the Government Pension Fund Global. Central government’s net foreign assets are calculated to NOK 4 211 billion at the end of the second quarter of 2013.
Net foreign assets continue to increase
Norway’s net foreign assets are calculated to NOK 3 595 billion at the end of the second quarter of 2013. This is up NOK 223 billion from the end of the first quarter of 2013. Norway’s net lending abroad was NOK 90 billion in the second quarter of 2013, which is NOK 5 billion higher than in the previous quarter. Net holding gains, due to exchange rate developments in foreign exchange and global security markets, increased the value of net financial assets abroad by NOK 134 billion in the second quarter of 2013.
Contact
-
Torbjørn Cock Rønning
E-mail: torbjorn.cock.ronning@ssb.no
tel.: (+47) 97 75 28 57
-
Jon Ivar Røstadsand
E-mail: jon-ivar.rostadsand@ssb.no
tel.: (+47) 21 09 43 69
-
Marit Eline Sand
E-mail: marit.sand@ssb.no
tel.: (+47) 40 90 26 74
