Content
Published:
This is an archived release.
Net lending is falling
Households’ net lending was NOK -32 billion in the third quarter of 2015, which followed a NOK 12 billion fall in the last four-quarter period. Financial investments declined more than borrowing in the same period.
| 3rd quarter 2014 | 4th quarter 2014 | 1st quarter 2015 | 2nd quarter 2015 | 3rd quarter 2015 | |
|---|---|---|---|---|---|
| 1Seasonal adjusted | |||||
| Assets | 3 674 786 | 3 752 376 | 3 809 407 | 3 882 446 | 3 871 113 |
| Liabilities | 2 865 451 | 2 938 855 | 2 958 158 | 3 032 879 | 3 050 218 |
| Net financial assets | 809 335 | 813 521 | 851 249 | 849 567 | 820 895 |
| Net lending | -6 598 | -4 673 | 9 413 | -18 108 | -18 949 |
| Other changes | 10 880 | 8 859 | 28 315 | 16 426 | -9 723 |
| Debt to income ratio1 | 225.5 | 226.2 | 227.3 | 227.7 | 228.0 |
| Debt growth (per cent)1 | 6.2 | 6.2 | 6.4 | 6.5 | 6.3 |
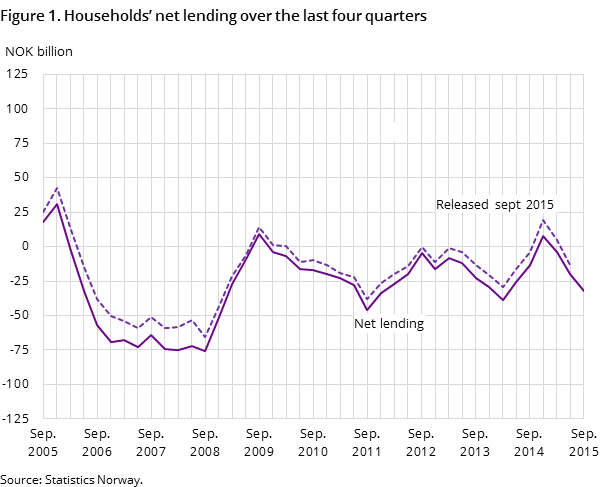
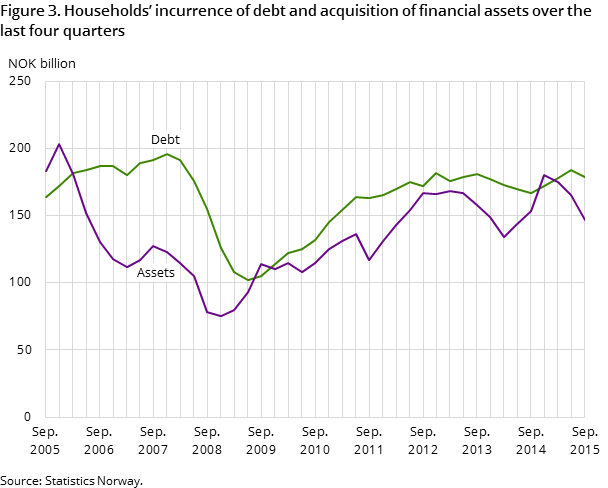
Investments in financial assets fell by NOK 17 billion to NOK 147 billion in the four-quarter period to the third quarter of 2015. At the same time, borrowing fell by NOK 5 billion from the previous four-quarter period and debt grew by NOK 179 billion. The main picture is dominated by the declining financial investments, and the development explains the fall in households’ net lending in the last four-quarter period.
Assets to income ratio decreases
Investments have seen a particular decline in the last quarter. Investments in financial assets were calculated to NOK -2.5 billion in the third quarter of 2015 compared to NOK 15 billion in the same quarter the previous year. The decline in the third quarter is due to negative developments in bank deposits and equity investments, net redemption of mutual fund shares and lower earned reserves in life and pension insurance. The modest development contributed to the fall in households´ assets to income ratio by 1.2 percentage points to 289.9 per cent at the end of the quarter. The fall in the assets to income ratio is also due to holding losses on securities, which totalled NOK 9 billion. The value of households’ financial assets was reduced by NOK 11 billion to NOK 3 871 billion at the end of the third quarter of 2015.
Debt growth slows down, but debt income ratio increases
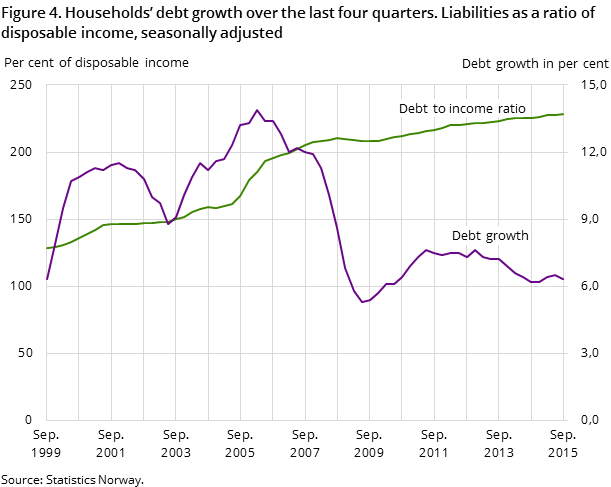
The opposite development occurred for debt, which rose by NOK 27 billion in the third quarter to NOK 3 050 billion at the end of the quarter. Debt growth is estimated at 6.3 per cent in the last quarter compared to 6.5 per cent in the previous quarter. Despite lower debt growth, the debt continued to increase faster than households’ income. The development is reflected by an increase in the debt of income ratio, which was estimated at 228.0 per cent of disposable income at the end of the third quarter of 2015. This is 0.3 percentage points higher than at the end of the previous quarter.
Households’ net debt to banks and mortgage companies increases
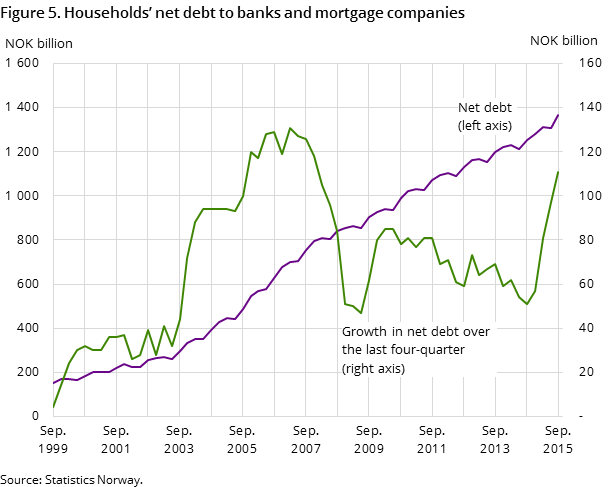
The two sectors with the greatest assets in households are banks and mortgage companies. Net debt to banks and mortgage companies is calculated to NOK 1 365 billion at the end of the third quarter of 2015 and the debt grew by NOK 111 billion in the last four-quarter period. This is the highest growth in a four-quarter period since the years preceding the financial crisis. The development can be explained by deposits that grew by NOK 60 billion and debt in banks and mortgage companies that grew by NOK 171 billion. One explanatory factor behind the debt growth in the last four-quarter period is the transfer of loans from the central government to the banking sector.
Net financial assets decrease
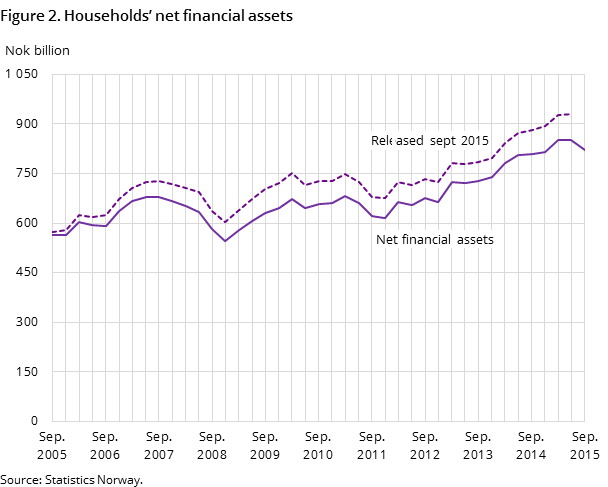
Households’ net financial assets to income ratio is calculated to 61.7 per cent of disposable income. This is 1.5 percentage points lower than at the end of the second quarter of 2015. Net financial assets fell by almost NOK 29 billion in the third quarter of 2015 and net financial assets were calculated to NOK 821 billion at the end of the quarter.
Revisions from the previous quarter
Financial accounts are updated every quarter with new data for the last published quarter and revised data for the previous released quarters (historic quarters). Implementation of updated and revised source statistics in the compilation procedures for the historic quarters leads to revisions in the time series for all sectors in the database system (Finse).
Households
Two revisions have significantly changed the time series for households in the financial accounts. A new compilation method and new source statistics have been implemented for stocks and transactions in foreign shares and other accounts receivable towards the rest of the world. Foreign shares are mainly adjusted upwards in the period dating back to 1995, while other accounts receivable are adjusted downwards in the period dating back to 2005. The net effect of these revisions is decreased net lending and net financial assets in the period from the first quarter of 2005 to the second quarter of 2014. In the period up to 2005, the net effects of the revisions are more mixed.
Households´ acquisitions of unquoted shares issued by domestic non-financial corporations are also adjusted downwards in the period from the first quarter of 2007 to the second quarter 2015. This is due to revised methods and updated source data.
The effects of revisions on households´ time series differ between the quarters. Net lending in the second quarter of 2015 is very modestly adjusted in the most recent release of financial accounts. On the other hand, net financial assets were adjusted downwards by NOK 81 billion in the second quarter of 2015 to NOK 850 billion at the end of the quarter.
Other sector
There have been several revisions in the compilation methods for other sectors in the most recent release of financial accounts. Central government’s owner stakes in Norges Bank are implemented in the financial accounts from the fourth quarter of 1995. The change has led to a substantial upward revision of central government’s financial assets. A new method for calculation of transactions in derivatives is implemented for banks and mortage companies. This change has led to revisions in banks and mortgage companies’ net transactions in derivatives toward counterparts’ sectors.
From now on, the financial accounts will comprise compilations of non-financial corporations’ sector-internal loans and other receivables/payables. The new time series covers the whole period from the fourth quarter of 1995. Previously, these internal assets and liabilities were consolidated (read more about the new compilations in the box below). The composition of non-financial corporations’ deposits has also been change. Long-term deposits have been increased, while short-term deposits have been reduced. The counterpart sector is the rest of the world.
Private non-financial corporations’ internal assets and liabilitiesOpen and readClose
Inter-units’ assets and liabilities within the same cooperation group are usually made related to funding and repatriate cash, such as loan to a business unit inside the group for investments purposes or group’s contributions that are not yet paid out. Historically these figures were not estimated in the Norwegian financial accounts due to lack of observable data sources.
In order to apply the principle of the European System of National Accounts 2010 for non-consolidated sector balance sheets, we have now estimated the inter-units’ assets and liabilities for private non-financial corporations by using tax returns data.
Contact
-
Torbjørn Cock Rønning
E-mail: torbjorn.cock.ronning@ssb.no
tel.: (+47) 97 75 28 57
-
Jon Ivar Røstadsand
E-mail: jon-ivar.rostadsand@ssb.no
tel.: (+47) 21 09 43 69
-
Marit Eline Sand
E-mail: marit.sand@ssb.no
tel.: (+47) 40 90 26 74
