Content
Published:
This is an archived release.
Slowdown in the Norwegian economy
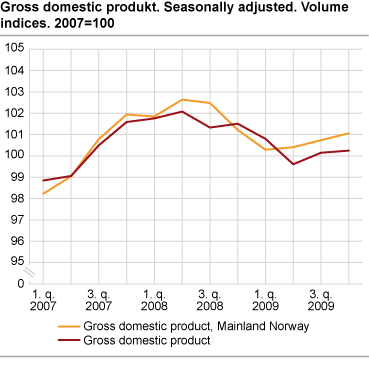
Annual gross domestic product (GDP) measured in constant prices fell for the first time in 20 years. Both GDP and GDP Mainland Norway fell by 1.5 per cent from 2008 to 2009.
The downturn in the mainland economy started in the 3r d quarter of 2008 and continued throughout the 1st quarter of 2009. The drop in activity seized in the second quarter, and the last three quarters of 2009 shows a slight increase in economic growth. From the 3rd to the 4th quarter, the growth in GDP Mainland Norway was 0.3 per cent. Export led industries and wholesale and retail trade contributed strongly to the drop in activity in the beginning of 2009, while business services was the main source of dampened growth in the second half of the year. Increased activity in general government contributed positively throughout 2009 and helped offset the downturn in the Norwegian economy.
Increased goods production
Value added in manufacturing rose by 1.0 per cent in the 4th quarter, with production of basic chemicals and metals being the main contributors. A decline beginning in the 3rd quarter of 2008 and continuing throughout the 2nd quarter of 2009 however, led to a fall in manufacturing by 5.8 per cent for 2009 as a whole. The decline may be tied to a drop in both domestic and foreign demand. The exemption was record high investments in oil and gas extraction which fuelled activity in parts of manufacturing industries.
An increase in the production of electricity as well as fishing and fish farming contributed to a growth rate of 0.9 per cent in the production of other goods in the 4th quarter. Reduced activity in construction dampened the growth. For 2009 as a whole, value added in production of other goods was reduced by 3.8 per cent.
Slowdown in service activities
Production in service producing industries fell by 0.1 per cent in the 4th quarter and dampened growth of GDP Mainland Norway. Financial intermediation and business services were the main sources of the negative numbers, while transport industries and wholesale and retail trade contributed positively. For 2009 as a whole, growth in service industries dropped by 1.0 per cent, mainly due to a sharp decline in business services, wholesale and retail trade and transport industries.
| 2008 | 2009 | 3rd quarter 2008 | 4th quarter 2008 | 1st quarter 2009 | 2nd quarter 2009 | 3rd quarter 2009 | 4th quarter 2009 | ||||||||||||||||||||||||||||||||||||||||||||||||||||||||||||||||||||||||
|---|---|---|---|---|---|---|---|---|---|---|---|---|---|---|---|---|---|---|---|---|---|---|---|---|---|---|---|---|---|---|---|---|---|---|---|---|---|---|---|---|---|---|---|---|---|---|---|---|---|---|---|---|---|---|---|---|---|---|---|---|---|---|---|---|---|---|---|---|---|---|---|---|---|---|---|---|---|---|---|
| Gross domestic product (GDP) | 1.8 | -1.5 | -0.7 | 0.2 | -0.7 | -1.2 | 0.5 | 0.1 | |||||||||||||||||||||||||||||||||||||||||||||||||||||||||||||||||||||||
| GDP Mainland-Norway | 2.2 | -1.5 | -0.1 | -1.2 | -0.9 | 0.1 | 0.3 | 0.3 | |||||||||||||||||||||||||||||||||||||||||||||||||||||||||||||||||||||||
| Petroleum activities and ocean transport | 0.6 | -1.7 | -2.6 | 4.8 | 0.0 | -5.2 | 1.2 | -0.6 | |||||||||||||||||||||||||||||||||||||||||||||||||||||||||||||||||||||||
| Final domestic use of goods and services | 2.5 | -3.0 | 1.3 | -2.9 | -1.5 | 0.7 | -0.7 | 0.5 | |||||||||||||||||||||||||||||||||||||||||||||||||||||||||||||||||||||||
| Final consumption exp. of households | 1.2 | -0.1 | -1.0 | -1.0 | -0.3 | 1.0 | 1.2 | 1.3 | |||||||||||||||||||||||||||||||||||||||||||||||||||||||||||||||||||||||
| Final consumption exp. of general government | 4.1 | 5.2 | 1.0 | 0.6 | 2.0 | 1.5 | 1.2 | 0.1 | |||||||||||||||||||||||||||||||||||||||||||||||||||||||||||||||||||||||
| Gross fixed capital formation | 1.4 | -7.9 | 1.5 | -2.1 | -4.6 | -0.5 | -4.9 | 0.3 | |||||||||||||||||||||||||||||||||||||||||||||||||||||||||||||||||||||||
| Exports | 0.9 | -4.3 | -3.8 | 1.7 | -3.5 | -2.9 | 3.3 | 1.0 | |||||||||||||||||||||||||||||||||||||||||||||||||||||||||||||||||||||||
| Imports | 2.2 | -9.7 | 0.2 | -6.2 | -7.4 | 1.9 | 0.9 | 2.6 | |||||||||||||||||||||||||||||||||||||||||||||||||||||||||||||||||||||||
| Total employed | 3.1 | -0.4 | 1.1 | -0.3 | -0.5 | -0.3 | -0.3 | 0.1 | |||||||||||||||||||||||||||||||||||||||||||||||||||||||||||||||||||||||
| Total man-hours worked | 3.4 | -1.5 | 0.9 | -0.7 | -0.7 | -0.2 | -0.4 | 0.0 | |||||||||||||||||||||||||||||||||||||||||||||||||||||||||||||||||||||||
Continued growth in consumption of motor vehicles
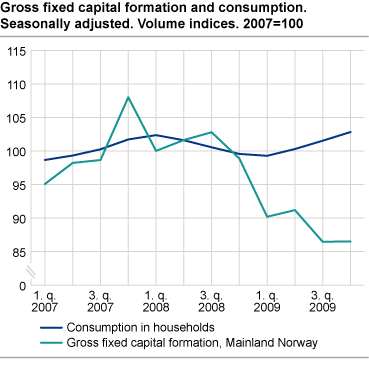
Household final consumption expenditure shows positive growth rates for the third quarter in a row, and as in the previous quarters the growth stems first and foremost from the households consumption of cars. The consumption of services rose moderately by 0.2 per cent in the same period. From 2008 to 2009 household final consumption expenditure remained roughly constant. Consumption expenditures of central and local government grew by 5.2 per cent in 2009, and were unchanged from the 3rd to the 4th quarter.
Drop in investments in manufacturing industries
Gross fixed capital formation in manufacturing fell by an annual rate of 34.2 per cent in 2009. The sharp decline should however be viewed in conjunction with the high level of investment expenditure in 2008. In the 4th quarter manufacturing investments fell by 5.1 per cent. Gross fixed capital formation in oil and gas extraction increased by 7.4 per cent from 2008 to 2009. Households dwelling investments has shown a continual decline during the last two and a half years, and the figure for the 4th quarter of 2009 is a drop of 3.9 per cent. The annual fall in dwelling investments was almost 19 per cent from 2008 to 2009.
Reduced trade surplus
The Norwegian trade surplus was reduced by almost 30 per cent from 2008 to 2009. The decline is due to a fall in the price of crude oil, natural gas and other petroleum products.
The percentage decline in volume of exports from the previous year was 4.3 per cent in 2009. The sharpest decline was seen in export of traditional goods, which is largely due to a drop in demand for metals and other basic chemicals. Exports of traditional goods picked up in the 3rd quarter and were largely unchanged in the 4th quarter. Combined volume of imports fell by 9.7 per cent from 2008 to 2009. Imports of traditional goods fell by 13.7 per cent, by and large due to a decline in imports of machinery and other equipment, metals and vehicles. Imports of traditional goods increased slightly in the 3rd quarter, but fell by 0.7 per cent in the 4th quarter.
Modest decline in employment figures
While increasing slightly in the 4th quarter, the number of employed persons fell by 0.4 per cent from 2008 to 2009. Total hours worked fell by 1.5 per cent for 2009 as a whole. The divergence between employment and total hours worked is due among other things to an increase in the rate of sick leave, reduced use of overtime and an increase in the number of lay-offs. The drop in employment was most noticeable in manufacturing, wholesale and retail trade and in construction, while positive employment growth was seen in health- and social services in central and local government.
Revisions of 2009
Due to incorporation of new statistics, previous quarters are subject to ongoing revisions. Unadjusted figures for GDP and GDP Mainland Norway are unchanged in the 1st quarter. GDP Mainland Norway has been revised downward 0.1 percentage points both in the 2nd and the 3rd quarter. The seasonally adjusted figures have been revised down by 0.2 percentage points for the same quarters. Unadjusted figures for total GDP has been adjusted down by 0.1 percentage points in the 2nd quarter and 0.3 percentage points for the 3rd quarter while the seasonally adjusted figures have been revised down by 0.3 percentage points in the 2nd quarter and 0.4 percentage points in the 3rd quarter.
| 2008 | 1st quarter 2009 | 2nd quarter 2009 | 3rd quarter 2009 | ||||||||||||||||||||||||||||||||||||||||||||||||||||||||||||||||||||||||||||
|---|---|---|---|---|---|---|---|---|---|---|---|---|---|---|---|---|---|---|---|---|---|---|---|---|---|---|---|---|---|---|---|---|---|---|---|---|---|---|---|---|---|---|---|---|---|---|---|---|---|---|---|---|---|---|---|---|---|---|---|---|---|---|---|---|---|---|---|---|---|---|---|---|---|---|---|---|---|---|---|
| New result | Former result | Seasonally adjusted figures | Unadjusted figures | Seasonally adjusted figures | Unadjusted figures | Seasonally adjusted figures | Unadjusted figures | ||||||||||||||||||||||||||||||||||||||||||||||||||||||||||||||||||||||||
| Percentage change in volume from the previous period | Percentage change in volume from the same period in the previous year | Percentage change in volume from the previous period | Percentage change in volume from the same period in the previous year | Percentage change in volume from the previous period | Percentage change in volume from the same period in the previous year | ||||||||||||||||||||||||||||||||||||||||||||||||||||||||||||||||||||||||||
| New result | Former result | New result | Former result | New result | Former result | New result | Former result | New result | Former result | New result | Former result | ||||||||||||||||||||||||||||||||||||||||||||||||||||||||||||||||||||
| Gross domestic product (GDP) | 1.8 | 1.8 | -0.7 | -0.7 | 1.2 | 1.2 | -1.2 | -0.9 | -5.1 | -5.0 | 0.5 | 0.9 | -1.0 | -0.7 | |||||||||||||||||||||||||||||||||||||||||||||||||||||||||||||||||
| GDP Mainland Norway | 2.2 | 2.2 | -0.9 | -0.9 | 0.8 | 0.8 | 0.1 | 0.3 | -5.3 | -5.2 | 0.3 | 0.5 | -1.3 | -1.2 | |||||||||||||||||||||||||||||||||||||||||||||||||||||||||||||||||
| Household final consumtion expenditure | 1.2 | 1.2 | -0.3 | -0.4 | -2.6 | -2.6 | 1.0 | 1.1 | -2.1 | -2.1 | 1.2 | 1.1 | 0.9 | 0.8 | |||||||||||||||||||||||||||||||||||||||||||||||||||||||||||||||||
| Final consumption of general government | 4.1 | 4.1 | 2.0 | 2.3 | 7.7 | 7.9 | 1.5 | 1.8 | 1.0 | 1.5 | 1.2 | 1.2 | 6.3 | 6.9 | |||||||||||||||||||||||||||||||||||||||||||||||||||||||||||||||||
| Gross fixed capital formation | 1.4 | 1.4 | -4.6 | -5.0 | -4.6 | -4.4 | -0.5 | -0.5 | -6.2 | -6.0 | -4.9 | -4.8 | -11.4 | -11.3 | |||||||||||||||||||||||||||||||||||||||||||||||||||||||||||||||||
| Exports | 0.9 | 0.9 | -3.5 | -4.6 | -3.0 | -4.4 | -2.9 | -2.9 | -9.7 | -10.7 | 3.3 | 4.6 | -2.2 | -1.4 | |||||||||||||||||||||||||||||||||||||||||||||||||||||||||||||||||
| Imports | 2.2 | 2.2 | -7.4 | -7.8 | -12.2 | -11.9 | 1.9 | 1.5 | -13.8 | -13.7 | 0.9 | -0.8 | -10.1 | -12.0 | |||||||||||||||||||||||||||||||||||||||||||||||||||||||||||||||||
| 2008 | 2009 | ||||||||||||||||||||||||||||||||||||||||||||||||||||||||||||||||||||||||||||||
|---|---|---|---|---|---|---|---|---|---|---|---|---|---|---|---|---|---|---|---|---|---|---|---|---|---|---|---|---|---|---|---|---|---|---|---|---|---|---|---|---|---|---|---|---|---|---|---|---|---|---|---|---|---|---|---|---|---|---|---|---|---|---|---|---|---|---|---|---|---|---|---|---|---|---|---|---|---|---|---|
| 1st quarter | 2nd quarter | 3rd quarter | 4th quarter | 1st quarter | 2nd quarter | 3rd quarter | 4th quarter | ||||||||||||||||||||||||||||||||||||||||||||||||||||||||||||||||||||||||
| Sweden | 0.4 | -0.2 | -0.5 | -4.8 | -0.8 | 0.3 | 0.2 | .. | |||||||||||||||||||||||||||||||||||||||||||||||||||||||||||||||||||||||
| Denmark | -1.0 | 0.9 | -1.0 | -2.5 | -1.4 | -2.3 | 0.6 | .. | |||||||||||||||||||||||||||||||||||||||||||||||||||||||||||||||||||||||
| Finland | 0.2 | 0.9 | 0.2 | -4.1 | -4.9 | -0.3 | 0.3 | .. | |||||||||||||||||||||||||||||||||||||||||||||||||||||||||||||||||||||||
| Germany | 1.6 | -0.6 | -0.3 | -2.4 | -3.5 | 0.4 | 0.7 | 0.0 | |||||||||||||||||||||||||||||||||||||||||||||||||||||||||||||||||||||||
| France | 0.5 | -0.4 | -0.2 | -1.5 | -1.4 | 0.3 | 0.3 | 0.6 | |||||||||||||||||||||||||||||||||||||||||||||||||||||||||||||||||||||||
| UK | 0.7 | -0.1 | -0.9 | -1.8 | -2.5 | -0.7 | -0.2 | 0.1 | |||||||||||||||||||||||||||||||||||||||||||||||||||||||||||||||||||||||
| USA | -0.2 | 0.4 | -0.7 | -1.4 | -1.6 | -0.2 | 0.6 | 1.4 | |||||||||||||||||||||||||||||||||||||||||||||||||||||||||||||||||||||||
| Norway | 0.2 | 0.3 | -0.7 | 0.2 | -0.7 | -1.2 | 0.5 | 0.1 | |||||||||||||||||||||||||||||||||||||||||||||||||||||||||||||||||||||||
Tables
Contact
-
Pål Sletten
E-mail: pal.sletten@ssb.no
tel.: (+47) 99 29 06 84
-
Ingunn Sagelvmo
E-mail: ingunn.sagelvmo@ssb.no
tel.: (+47) 40 90 26 32
-
Pia Tønjum
E-mail: pia.tonjum@ssb.no
tel.: (+47) 48 99 12 07
-
Kristian Gimming
E-mail: kristian.gimming@ssb.no
tel.: (+47) 91 88 39 06


