Content
Published:
This is an archived release.
Savings remain high in Norway
Preliminary figures for 2008 show that savings in Norway amount to NOK 744 billion, which is NOK 143 billion more than the previous year. Disposable income increased by 6.7 per cent from 2007 to 2008.
National income for Norway in 2006 amounted to NOK 2 248 billion, which is a growth rate of 12 per cent compared to the previous year. The growth can mainly be explained by an increase in the GDP and property income and wages form the rest of the world.
Disposable income for Norway in 2008 amounts to NOK 2 226 billion, and grew by 11.8 per cent from 2007. Disposable real income however rose by 6.7 per cent. In comparison, the growth rate was 3.2 per cent from 2006 to 2007. Per capita, the increase in disposable real income was 1.7 higher in 2008.
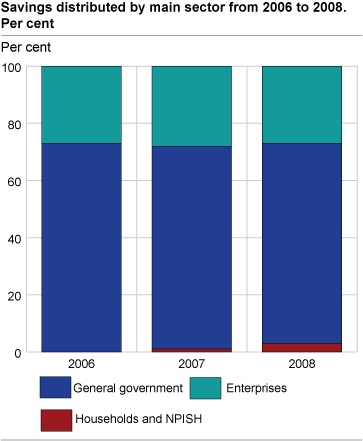
Previous years show that the level of savings in Norway has been high. Consumption grew less than disposable income and this development caused a rise in savings from NOK 601 billion in 2007 to NOK 744 billion in 2008. This is an increase from 2007 of 143 NOK billion, which mainly can be explained by savings in general government.
Increased savings in households
Disposable income for households and non-profit organisations serving households amounts to NOK 983 billion, which is an increase of 7.1 per cent compared with the previous year. Disposable real income rose by 2.4 per cent from 2007 to 2008. An 8.7 growth in earned income was the reason for the development in wages, which is the most important income component for households.
Savings for 2008 are estimated at NOK 21 billion and are NOK 17 billion higher than the previous year. This is mainly due to lower consumption than in 2007. Growth in consumption in 2008 was 5.4 per cent and 6.8 per cent in 2007. The savings ratio, which shows savings as a ratio of disposable income, was 2.1 per cent compared with 0.4 per cent in 2007.
Government - Norway’s savings box
Savings in Norway are dominated by the government, which constitutes 72 per cent of total savings. In 2008, savings amounted to NOK 523 billion, or grew by 21 per cent annually. The strong increase can mainly be explained by tax revenue from oil activity. Taxes from the oil activity rose by 28 per cent and are estimated at NOK 244 billion. In addition, dividends increased by NOK 60 billion, which is 38 per cent higher than in 2007.
Increased savings and reduced net lending in enterprises
Preliminary figures for 2008 show that savings in the enterprise sector amount to almost NOK 200 billion. This is an increase of 19.6 per cent, or a growth of NOK 32 billion. Net lending however was NOK 10 billion less than in 2007 and amounted to NOK 14 billion in 2008.
Tables
The statistics is now published as National accounts, non-financial sector accounts.
Additional information
Contact
-
Statistics Norway's Information Centre
E-mail: informasjon@ssb.no
tel.: (+47) 21 09 46 42

