Content
Published:
This is an archived release.
Decreased savings for Norway in 2009
Preliminary figures show that savings in Norway were NOK 490 billion, which is more than NOK 233 billion lower than the previous year. For the first time since 2002, the growth in disposable real income is negative. The decline from 2008 to 2009 was 10 per cent.
National income for Norway in 2009 was NOK 2 065 billion. This is a decline of NOK 150 billion compared to preliminary figures for 2008. When including net transfers and benefits from abroad, which were NOK 6 billion higher in 2009 than in 2008, disposable income totalled NOK 2 037 billion. This is a drop in disposable income of NOK 155 billion compared to 2008.
The decline in national income, disposable income and savings can generally be explained by the decline in gross domestic product (GDP), which shows a decrease of NOK 135 billion compared with 2008. This decline is mainly due to lower production income, particularly from oil and gas-related industries, where average prices showed a solid fall compared to 2008. For further details of GDP, see the link to KNR.
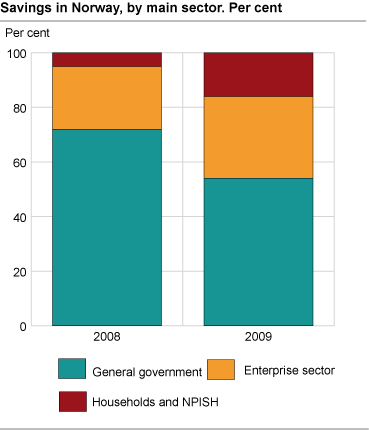
Savings for Norway is estimated at NOK 490 billion, which is a reduction of NOK 223 billion. The savings rate; savings as a share of disposable income, was 24 per cent, which is 9 percentage points lower than in 2008. Although 2009 shows a fall in the savings rate, it is relatively high historically.
Reduced disposable income for Norway
Disposable real income, which is disposable income deflated by price change, was reduced by 10 per cent. This development is in contrast to 2008, with a growth of 7.9 per cent. The main explanation for the fall in real disposable income is the terms of trade from abroad and the fall in average oil prices.
Increased savings in households
Disposable income in 2009 totalled NOK 1 064 billion, which is an increase of 7.4 per cent compared with the previous year. Behind this development is a moderate increase in wages and a strong reduction in property income expenses, which is caused by lower interest rates.
Savings for the households increased by NOK 45 billion and constituted NOK 80 billion in 2009. The savings rate was 7.5 per cent, which is an increase of 4 percentage points compared to 2008.
For more details on households, see KVINS.
| For Norway | 2008 | 2009 | Growth in percent | ||||||||||||||||||||||||||||||||||||||||||||||||||||||||||||||||||||||||||||
|---|---|---|---|---|---|---|---|---|---|---|---|---|---|---|---|---|---|---|---|---|---|---|---|---|---|---|---|---|---|---|---|---|---|---|---|---|---|---|---|---|---|---|---|---|---|---|---|---|---|---|---|---|---|---|---|---|---|---|---|---|---|---|---|---|---|---|---|---|---|---|---|---|---|---|---|---|---|---|---|
| GDP | 2 543 189 | 2 408 325 | -5.3 | ||||||||||||||||||||||||||||||||||||||||||||||||||||||||||||||||||||||||||||
| Disposable income | 2 192 896 | 2 037 438 | -7.1 | ||||||||||||||||||||||||||||||||||||||||||||||||||||||||||||||||||||||||||||
| Savings for Norway | 713 767 | 490 284 | -31.3 | ||||||||||||||||||||||||||||||||||||||||||||||||||||||||||||||||||||||||||||
| Disposable real income | 1 749 478 | 1 572 151 | 10.1 | ||||||||||||||||||||||||||||||||||||||||||||||||||||||||||||||||||||||||||||
| Savings rate in percent | 33 | 24 | |||||||||||||||||||||||||||||||||||||||||||||||||||||||||||||||||||||||||||||
| Households and NPISH | |||||||||||||||||||||||||||||||||||||||||||||||||||||||||||||||||||||||||||||||
| Disposable income | 990 942 | 1 064 457 | 7.4 | ||||||||||||||||||||||||||||||||||||||||||||||||||||||||||||||||||||||||||||
| Consumption in households and NPISH | 947 061 | 1 012 253 | 6.9 | ||||||||||||||||||||||||||||||||||||||||||||||||||||||||||||||||||||||||||||
| Saving | 33 981 | 79 450 | 133.8 | ||||||||||||||||||||||||||||||||||||||||||||||||||||||||||||||||||||||||||||
| Disposable real income | 853 265 | 894 283 | 4.8 | ||||||||||||||||||||||||||||||||||||||||||||||||||||||||||||||||||||||||||||
| Savings rate in percent | 3.4 | 7.5 | |||||||||||||||||||||||||||||||||||||||||||||||||||||||||||||||||||||||||||||
| General Govenment | |||||||||||||||||||||||||||||||||||||||||||||||||||||||||||||||||||||||||||||||
| Disposable income | 1 005 909 | 800 446 | -20.4 | ||||||||||||||||||||||||||||||||||||||||||||||||||||||||||||||||||||||||||||
| Consumption in general govenment | 491 816 | 534 901 | 8.8 | ||||||||||||||||||||||||||||||||||||||||||||||||||||||||||||||||||||||||||||
| Saving | 514 093 | 265 545 | -48.5 | ||||||||||||||||||||||||||||||||||||||||||||||||||||||||||||||||||||||||||||
| Savings rate in percent | 51.1 | 33.2 | |||||||||||||||||||||||||||||||||||||||||||||||||||||||||||||||||||||||||||||
| Enterprises | |||||||||||||||||||||||||||||||||||||||||||||||||||||||||||||||||||||||||||||||
| Disposable income | 196 045 | 172 536 | -12.0 | ||||||||||||||||||||||||||||||||||||||||||||||||||||||||||||||||||||||||||||
| Adjustment, household pension funds | 30 352 | 27 246 | -10.2 | ||||||||||||||||||||||||||||||||||||||||||||||||||||||||||||||||||||||||||||
| Saving | 165 693 | 145 290 | -12.3 | ||||||||||||||||||||||||||||||||||||||||||||||||||||||||||||||||||||||||||||
| Savings rate in percent | 84.5 | 84.2 | |||||||||||||||||||||||||||||||||||||||||||||||||||||||||||||||||||||||||||||
Strong fall in savings in central government
Savings in Norway take place in central government. In 2009, savings in central government constituted 55 per cent of total savings, which is a fall of 19 percentage points from 2008.
In 2009, savings in central government fell by NOK 259 billion. Savings in total for central government were NOK 221 billion. The reason for the fall is mainly reduced tax income from oil and gas-related activity, together with lower dividends. In addition, there was a rise in pensions and benefit expenses.
This is in contrast to local government which has low savings. In 2008 and 2009 savings were negative.
Increased net lending in enterprises
Production income in the enterprise sector had a substantial fall from 2008 to 2009. At the same time, property income is reduced due to lower interest rates and lower disbursements of dividends. Disposable income for the enterprise sector fell by NOK 25 billion from 2008 to 2009. Gross fixed capital formation fell more than disposable income thus leading to a rise in net lending by NOK 41 billion from 2008 to 2009.
Tables
The statistics is now published as National accounts, non-financial sector accounts.
Additional information
Contact
-
Statistics Norway's Information Centre
E-mail: informasjon@ssb.no
tel.: (+47) 21 09 46 42

