Content
Published:
This is an archived release.
Increased savings in Norway in 2010
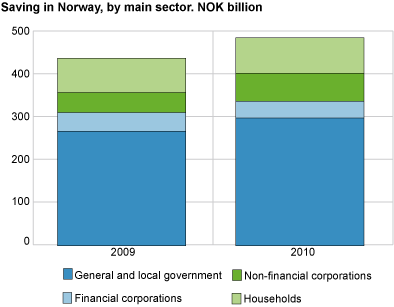
Preliminary figures show that savings in Norway were NOK 487 billion, which is almost NOK 50 billion higher than the previous year. This is still considerably lower than in the years 2006-2008.
National income for Norway in 2010 was NOK 2 144 billion. This is nearly NOK 130 billion higher than in 2009. When including net transfers and benefits from abroad, disposable income totalled NOK 2 114 billion in 2010.
Gross domestic product (GDP) increased by NOK 124 billion in 2010, and this explains much of the rise in national income. For further details of GDP, see the link to KNR .
Savings in Norway are estimated at NOK 487 billion, which is an increase of NOK 47 billion. The savings rate; savings as share of disposable income, was 23 per cent, about the same as in 2009. This is clearly lower than the savings rate from 2005 to 2008.
Continued increase in disposable real income for households
Disposable income for households and non-profit institutions serving households was NOK 1 125 billion in 2010, which is an increase of 5.8 per cent compared with the previous year. Disposable real income also showed an increase in 2010 and was 3.8 per cent higher than the year before. Increase in compensation of employees, payments and benefits from general government and net property income contributed to the growth in real disposable income.
Savings of households increased by NOK 2.6 billion and were about NOK 82.9 billion in 2010. Savings’ share of disposable income, the saving rate, is measured at 7.4 per cent, about the same as in 2009.
For more information about the household sector, go to National accounts, quarterly sector accounts.
Increased savings in general government and enterprises
General government’s share of total savings was 61 per cent in 2010, about the same as the previous year. The savings in central government increased by 31 per cent from 2009 to 2010 and ended at NOK 299 billion. The savings in the central government were 35 per cent in 2010, a slight increase from 2009. This is in contrast to local government which has low savings. Both in 2009 and 2010, saving and net investment in the local government were negative, while savings in the general government as a whole were positive.
The preliminary figures for 2010 show a saving in the corporate sector of NOK 105 billion. This is an increase of 15 per cent from the year before.
| 2009 | 2010 | Growth in per cent | |||||||||||||||||||||||||||||||||||||||||||||||||||||||||||||||||||||||||||||
|---|---|---|---|---|---|---|---|---|---|---|---|---|---|---|---|---|---|---|---|---|---|---|---|---|---|---|---|---|---|---|---|---|---|---|---|---|---|---|---|---|---|---|---|---|---|---|---|---|---|---|---|---|---|---|---|---|---|---|---|---|---|---|---|---|---|---|---|---|---|---|---|---|---|---|---|---|---|---|---|
| For Norway | |||||||||||||||||||||||||||||||||||||||||||||||||||||||||||||||||||||||||||||||
| GDP | 2 380 851 | 2 505 076 | 5.2 | ||||||||||||||||||||||||||||||||||||||||||||||||||||||||||||||||||||||||||||
| Disposable income for Norway | 1 987 682 | 2 114 646 | 6.4 | ||||||||||||||||||||||||||||||||||||||||||||||||||||||||||||||||||||||||||||
| Saving for Norway | 439 315 | 486 977 | 10.8 | ||||||||||||||||||||||||||||||||||||||||||||||||||||||||||||||||||||||||||||
| Disposable real income | 1 537 120 | 1 600 923 | 4.2 | ||||||||||||||||||||||||||||||||||||||||||||||||||||||||||||||||||||||||||||
| Savings rate in per cent | 22.1 | 23.0 | .. | ||||||||||||||||||||||||||||||||||||||||||||||||||||||||||||||||||||||||||||
| Households and NPISH | |||||||||||||||||||||||||||||||||||||||||||||||||||||||||||||||||||||||||||||||
| Disposable income | 1 063 920 | 1 125 222 | 5.8 | ||||||||||||||||||||||||||||||||||||||||||||||||||||||||||||||||||||||||||||
| Consumption in households and NPISH | 1 015 261 | 1 072 575 | 5.6 | ||||||||||||||||||||||||||||||||||||||||||||||||||||||||||||||||||||||||||||
| Saving | 80 256 | 82 897 | 3.3 | ||||||||||||||||||||||||||||||||||||||||||||||||||||||||||||||||||||||||||||
| Disposable real income | 895 122 | 928 693 | 3.8 | ||||||||||||||||||||||||||||||||||||||||||||||||||||||||||||||||||||||||||||
| Savings rate in per cent | 7.5 | 7.4 | .. | ||||||||||||||||||||||||||||||||||||||||||||||||||||||||||||||||||||||||||||
| General government | |||||||||||||||||||||||||||||||||||||||||||||||||||||||||||||||||||||||||||||||
| Disposable income | 801 061 | 854 298 | 6.6 | ||||||||||||||||||||||||||||||||||||||||||||||||||||||||||||||||||||||||||||
| Consumption in general government | 533 106 | 555 094 | 4.1 | ||||||||||||||||||||||||||||||||||||||||||||||||||||||||||||||||||||||||||||
| Saving | 267 955 | 299 204 | 11.7 | ||||||||||||||||||||||||||||||||||||||||||||||||||||||||||||||||||||||||||||
| Savings rate in per cent | 33.5 | 35.0 | .. | ||||||||||||||||||||||||||||||||||||||||||||||||||||||||||||||||||||||||||||
| Enterprises | |||||||||||||||||||||||||||||||||||||||||||||||||||||||||||||||||||||||||||||||
| Disposable income | 122 701 | 135 126 | 10.1 | ||||||||||||||||||||||||||||||||||||||||||||||||||||||||||||||||||||||||||||
| Adjustment, household pension funds | 31 597 | 30 250 | -4.3 | ||||||||||||||||||||||||||||||||||||||||||||||||||||||||||||||||||||||||||||
| Saving | 91 104 | 104 876 | 15.1 | ||||||||||||||||||||||||||||||||||||||||||||||||||||||||||||||||||||||||||||
| Savings rate in per cent | 74.3 | 77.6 | .. | ||||||||||||||||||||||||||||||||||||||||||||||||||||||||||||||||||||||||||||
Tables
The statistics is now published as National accounts, non-financial sector accounts.
Additional information
Contact
-
Statistics Norway's Information Centre
E-mail: informasjon@ssb.no
tel.: (+47) 21 09 46 42