Content
Published:
This is an archived release.
Disposable income and savings for Norway revised upwards
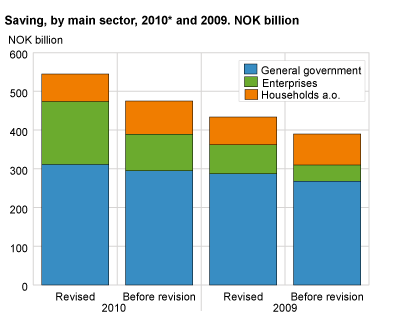
Revised figures for 2010 reveal that Norway’s total disposable income was NOK 2 188 billion, 82 billion higher than previously published. Total final consumption is also revised upwards, but to a lesser degree than the income and consequently Norway’s total savings is raised NOK 69 billion to NOK 544 billion.
Table 8 "Households and NPISHs. Contribution to growth in real disposable income. Percentage point" was published 1 December 2011. |
Both higher income from domestic production activities and higher returns on investments abroad compared to earlier estimates, can explain the revisions. Income from domestic production is revised partly due to updated information on the 2010 activities, and partly due to the results of a main revision of backwards time series carried out by Statistics Norway recently, see Annual national accounts . The main effect of this revision is that levels of GDP and other main aggregates since 2003 are revised.
The national accounts data up and until 2009 are now regarded as final, while the 2010 data are still preliminary.
Downward revision of savings and net lending in households and non-profit organisations.
The upward revision in Norway’s total savings in 2010 is first and foremost the result of revised estimates of savings in private and government owned enterprises. Higher primary income in terms of both domestic operating surplus and returns on direct investments abroad contribute positively to the revisions.
| 2006 | 2007 | 2008 | 2009 | 2010 | |||||||||||||||||||||||||||||||||||||||||||||||||||||||||||||||||||||||||||
|---|---|---|---|---|---|---|---|---|---|---|---|---|---|---|---|---|---|---|---|---|---|---|---|---|---|---|---|---|---|---|---|---|---|---|---|---|---|---|---|---|---|---|---|---|---|---|---|---|---|---|---|---|---|---|---|---|---|---|---|---|---|---|---|---|---|---|---|---|---|---|---|---|---|---|---|---|---|---|---|
| Real disposable income for Norway | 7.5 | 0.7 | 5.8 | -12.0 | 6.7 | ||||||||||||||||||||||||||||||||||||||||||||||||||||||||||||||||||||||||||
| Contribution to growth from | |||||||||||||||||||||||||||||||||||||||||||||||||||||||||||||||||||||||||||||||
| Production growth in the oil business | -1.5 | -1.3 | -0.8 | -0.7 | -1.3 | ||||||||||||||||||||||||||||||||||||||||||||||||||||||||||||||||||||||||||
| Production growth other | 3.8 | 3.8 | 0.2 | -2.0 | 1.6 | ||||||||||||||||||||||||||||||||||||||||||||||||||||||||||||||||||||||||||
| Change in terms of trade | 5.9 | -1.2 | 6.6 | -10.2 | 4.2 | ||||||||||||||||||||||||||||||||||||||||||||||||||||||||||||||||||||||||||
| Of which prices for crude oil and gas | 4.8 | -1.3 | 6.0 | -9.2 | 3.0 | ||||||||||||||||||||||||||||||||||||||||||||||||||||||||||||||||||||||||||
| Change in Balance of income and current transfers | -0.8 | -0.5 | -0.2 | 0.9 | 2.2 | ||||||||||||||||||||||||||||||||||||||||||||||||||||||||||||||||||||||||||
For the household sector, savings are revised downwards due new estimates of households’ final consumption expenditures. Savings in households and non-profit organisations is now estimated at NOK 71 billion for 2010, 16 billion below the former estimate. The savings rate is correspondingly revised down from 7.6 per cent to 6.3 per cent. With an upward revision in capital formation of households, net lending is revised down from earlier estimate and now corresponds more to the estimates from the financial accounts side.
Growth in real disposable income in 2010
Real disposable income increased by 6.7 percent from 2009 to 2010, after it fell by 12 percent the year before. In 2010, improved terms of trade contributed with 2/3 of the increase in real disposable income. Similarly, there was a deterioration in the terms of trade due to a decline in the prices of oil and gas, which decreased real income in 2009.
More on the main revision
The main reason for the recent main revision of the Norwegian national accounts is an adaption to the new industrial classification SN2007, based on EU’s industrial classification NACE rev.2. New information brought forward since the last main revision in 2006 has also been utilised, among others data on dwellings and property development activities, exports and imports of services and illegal and non-registered activities. For the household sector a new model of estimating operating surplus in the self employed sector has also been introduced.
An important change in presenting the sector accounts has been introduced as well. In the production account, output is now presented at basic prices, i.e. producer prices adjusted for taxes and subsidies on products, and thus more correctly measuring the income from production allocated to the producers.
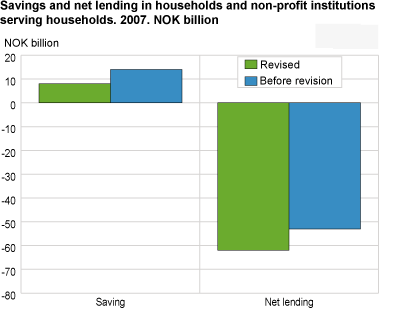
To illustrate some of the main results from the main revision, 2007 figures are used. Due to an upward revision in the level of GDP, the total national income is raised NOK 33 billion to NOK 2 006 billion. Since net current transfers to abroad have not been substantially revised, Norway’s total disposable income is also raised. Total final consumption expenditures are also higher than former estimates, and consequently Norway’s total savings is raised NOK 24 billion to NOK 589 billion. Total capital formation is however revised even more, resulting in a downward revision of Norway’s total net lending with the rest of the world in 2007.
For the household sector, final consumption expenditures and capital formation are revised up more than disposable income, bringing net lending down and more in line with the financial accounts.
The most striking result from the main revision of the non-financial sector accounts is the upward revision in disposable income and savings in the private and government owned enterprise sectors. Capital formation has also been revised upwards but to a lesser degree than income, bringing net borrowing for the sector up NOK 20 billion to NOK 83 billion in 2007.
For financial enterprises and general government sectors the figures for 2007 and earlier have been revised only to a minor degree.
For the rest of the world sector the most important revision has been done for exports and imports of services, by introducing levels from more recent established sample surveys. Exports have been revised down while imports the opposite way, reducing Norway’s current balance surplus with NOK 33 billion to NOK 287 billion for 2007.
For more information on the results from the main revision, see forthcoming edition of Economic survey no. 6/2011, to be released December the 8 th 2011.
Tables
The statistics is now published as National accounts, non-financial sector accounts.
Additional information
Contact
-
Statistics Norway's Information Centre
E-mail: informasjon@ssb.no
tel.: (+47) 21 09 46 42


