Content
Published:
This is an archived release.
Further increase in tourism consumption
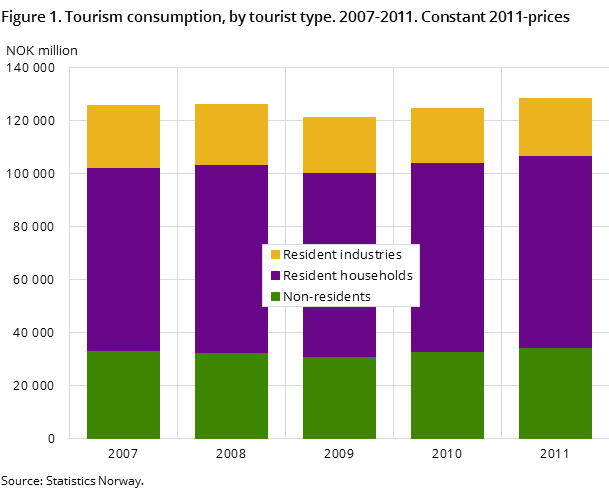
The years 2007-2011 were marked by extraordinary events that affected people’s ability and desire to travel. Overall, the tourists’ consumption was stable. Tourists spent almost NOK 130 billion in Norway in 2011. This was a good 2 per cent more than in 2007 when measured in volume.
| 2011 | 2009 | 2007 | |
|---|---|---|---|
| Total tourism consumption in Norway. NOK million | 128 526 | 119 639 | 115 544 |
| Non-residents' share of total tourism consumption in Norway. Per cent | 26.8 | 25.5 | 26.5 |
| Annual volume change in total tourism consumption. Per cent | 3.1 | -4.0 | |
| Resident households' tourism consumption in Norway as share of households' final consumption expenditure. Per cent | 6.7 | 6.9 | 6.9 |
| Value added in the tourism industries as share of GDP Mainland Norway. Per cent | 4.3 | 4.3 | 4.3 |
| Annual volume change in value added in the tourism industries.Per cent | 4.3 | -6.4 | |
| Employment in the tourism industries' share of total employment in Mainland Norway. Man year, full time equivalents, employees and self-employed. Per cent | 6.7 | 6.5 | 6.6 |


From 2007 to 2009, total tourism consumption fell by 3.6 per cent in volume. This must be viewed in conjunction with the financial crisis in 2008. The reduction in tourism consumption among Norwegian business travellers and foreign tourists pulled the results down the most.
After 2009, the tourism consumption increased again. Measured in volume, it increased by 6 per cent from 2009 to 2011, and the total tourism consumption in 2011 amounted to NOK 128.5 billion. This was 2.2 per cent higher than five years earlier when adjusted for changed prices over the period. In other words, the level was quite stable despite the financial crisis and turbulent times. This is illustrated in figure 1.
Norwegians’ wanderlust still strong
The Norwegian households were, to a greater degree than in previous years, tourists in their own country after the international financial crisis in 2008. Their consumption of goods and services whilst on holiday within the country was relatively good despite their tourism consumption in Norway falling by nearly 2 per cent in volume from 2008 to 2009. They stayed both privately and at commercial accommodation establishments. They allowed themselves cultural experiences, pleasure activities and some restaurant meals. The cuts in expenses were mainly on transport services to and from abroad, as well as package tours.
The financial crisis had few negative consequences for the Norwegian households, and their tourism consumption in Norway rose again after the decline in 2009. Simultaneously, their tourism consumption in Norway on services that took them abroad on holiday also increased. For the period 2007-2011, the household tourism consumption in Norway grew by 5 per cent in volume.
The foreign tourists returned strongly in 2010 and 2011 after a couple of weak years following the financial crisis. In 2011, non-residents’ tourism consumption was 3.6 per cent higher in volume than in 2007.
The business travellers, however, did not reach the same level as before the financial crisis. Here there was a decline of nearly 7 per cent in volume from 2007 to 2011. Costs were cut and restructured, and less was spent on conferences and transport.
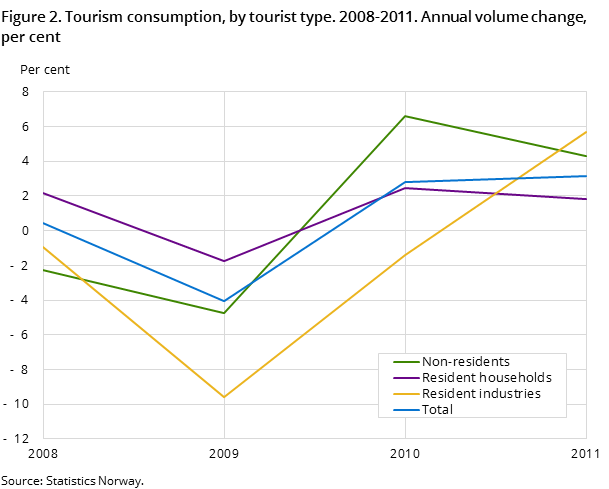
In other words, the desire and ability to travel varied throughout the period 2007-2011 and was affected by various factors: economic prosperity followed by tougher times after 2008; a strengthened currency; the ash cloud that halted all air travel in 2010; terror and war in 2011; and a lot of positive attention for Norway as a destination worth visiting from the national and international media. The various tourist types responded differently and were affected differently by the events of the period. Some affected the business travellers, others the leisure tourists, and some had an impact on domestic tourists and others on foreign tourists. How this influenced tourism consumption is illustrated in figure 2.
The tourism industries increased in scope
Tourism consumption grew in the period 2007-2011, as did the output and employment in the tourism industries. A comparison of all industries in Mainland Norway shows that the output in the tourism industries increased by more than the overall output. Their share of total output in 2011 amounted to 6 per cent; up from 5.6 per cent in 2007.
Employment measured in full-time equivalents grew by 4.7 per cent from 2007 to 2011. The food serving services experienced the strongest growth. More than half of the increase in employment was in this industry.
Compared to the employment in Mainland Norway in total, the situation was largely unchanged. In 2011, employment measured in full-time equivalents in the tourism industries constituted 6.7 per cent of the employment in Mainland Norway.
Tourists want cities, mountains and fjords
Regional tourism consumption figures are not computed for the current set of accounts. This has been done previously, and most recently for the reference year 2007. Since tourism products are mainly services produced by the tourism industries, and these services are produced, delivered and consumed at the same time and place, the computed figures for the supply side provide a good picture of the regional tourism consumption.
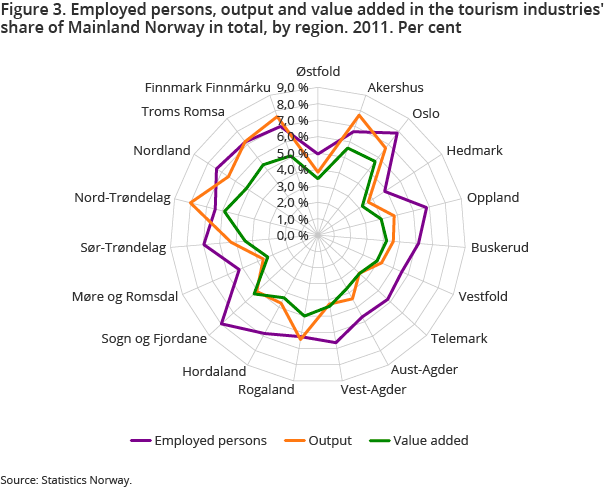
Half of the employed people in the tourism industries in 2011 worked in Oslo, Akershus, Rogaland and Hordaland, see figure 3.
An even higher share of the output in the tourism industries came from these four counties. Nearly NOK 6 out of NOK 10 was produced here.
In Oslo, nearly 8 per cent of all people employed worked in the tourism industries. Other counties where this share was high were Hordaland, Sogn og Fjordane, Oppland, Sør-Trøndelag and the three northernmost counties.
The importance of the tourism industries in terms of value added was high compared to the total value added in Oslo, Akershus, Rogaland and Hordaland. However, as with the employment, the importance was also high in the northernmost counties despite the level here being lower. The shares were 5-6 per cent.
Tourism consumption revised by NOK 12 billion
In 2011, Statistics Norway published revised national accounts for the years 1970-2010. The main reason for the revision was that the industrial classification standard that the economic statistics follow was updated. At the same time, new information was incorporated.
A revision of and new guidelines for the national accounts also entails a revision of the tourism satellite accounts. In addition to the changes in the standard industrial classification, in 2008 the international guidelines for tourism statistics and tourism satellite accounts were also updated. The changes are largely incorporated into the results that are published here. Additionally, new information has also been incorporated into the revised accounts.
The tourism satellite accounts are only revised back to 2007. In order to help users compare the time series beyond the break, two versions with final results for the reference year 2007 have been compiled, with figures from both before and after the main revision in 2011.
Tourism consumption is revised up by nearly 12 per cent to NOK 115.5 billion in 2007. The biggest revision is for Norwegian households’ tourism consumption, which increased from NOK 51.2 billion to NOK 63 billion. For all three tourist types, there are changes in the composition of the goods and services consumed.
The main reasons for the changes are:
- All tourism-related consumption is included and not just the additional consumption as previously. This constitutes a revision of over NOK 8 billion.
- Travel agency services were previously paid by the providers of the services intermediated in the form of commissions. This was intermediate consumption for these entities and not part of the tourism consumption. Nowadays, it is usually the person who will use the service intermediated who pays for the travel agency services in the form of fees. This is part of tourism consumption and constitutes more than NOK 2 billion.
- The level and classification in the national accounts have been revised for international transport services.
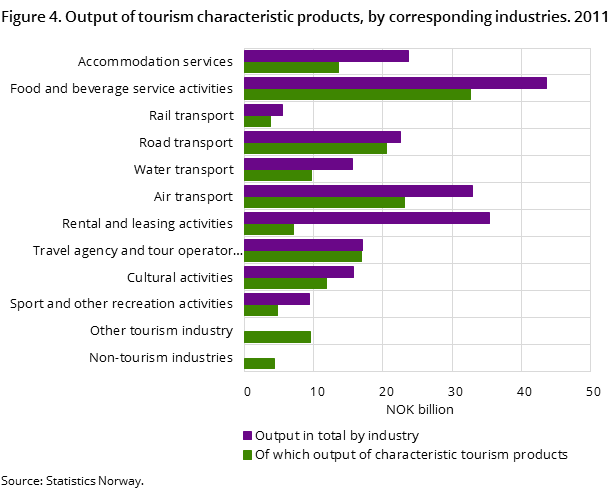
The composition of the tourism industries has been changed due to the change in the industrial classification standard. This has had positive consequences for cultural and entertainment activities, which no longer include news agencies. On the other hand, rental and leasing activities increased significantly as the industry now includes leasing of intellectual property, which includes the payment of franchise agreements. The relation between the output by tourism industries of all products and the output of characteristic tourism products by respective industry in 2011 is shown in figure 4.
In total, the output in the tourism industries increased by 4.2 per cent and the output of tourism products was revised up by 5.6 per cent.
New revised national accounts will be disseminated in November 2014. As a consequence, the tourism satellite accounts will also be revised again. This will be done in 2015.
Contact
-
Anne Mari Auno
E-mail: anne.auno@ssb.no
tel.: (+47) 40 90 26 11
