Content
Published:
This is an archived release.
Tourists spent more money
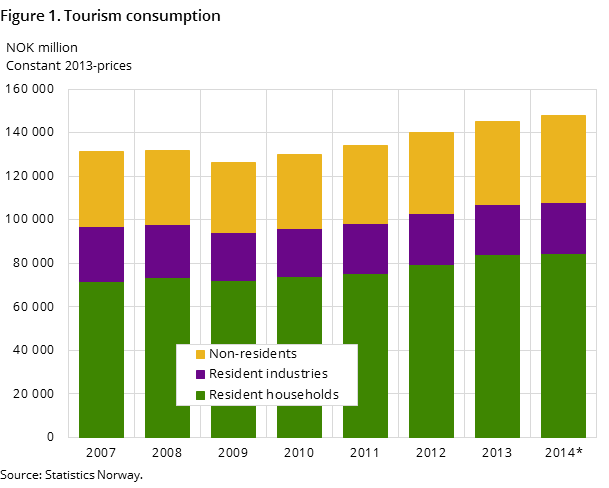
After a few years of moderate consumption the tourists’ demand picked up somewhat in the years 2011-2014. In total tourists spent NOK 150 billion in Norway in 2014, according to preliminary results. This was a good 10 per cent more than in 2011 and almost 13 per cent more than in 2007 when measured in volume.
| 2012 | 2013 | 20141 | |
|---|---|---|---|
| 1Preliminary figures | |||
| Total tourism consumption in Norway. NOK million | 136 882 | 145 156 | 151 512 |
| Non-residents' share of total tourism consumption in Norway. Per cent | 26.7 | 26.3 | 27.0 |
| Annual volume change in total tourism consumption. Per cent | 4.7 | 3.5 | 2.0 |
| Resident households' tourism consumption in Norway as share of households' final consumption expenditure. Per cent | 7.0 | 7.2 | 7.1 |
| Value added in the tourism industries as share of GDP Mainland Norway. Per cent | 4.3 | 4.2 | 4.1 |
| Annual volume change in value added in the tourism industries.Per cent | 1.2 | 2.7 | 2.2 |
| Employment in the tourism industries' share of total employment in Mainland Norway. Man year, full time equivalents, employees and self-employed. Per cent | 6.6 | 6.6 | 6.7 |


In particular holiday and leisure tourism pulled the amount up for both the Norwegian and foreign tourists. From 2011 to 2014 their tourism consumption in Norway increased by around 12.5 per cent in volume. Norwegian business travellers had a stable consumption level from 2011 to 2012, reduced it some in 2013 and increased it again in 2014. Their tourism consumption in Norway however, remained 6.5 per cent under the pre-financial crises consumption level. All results for 2014 are preliminary.
Foreigners pining for Norway
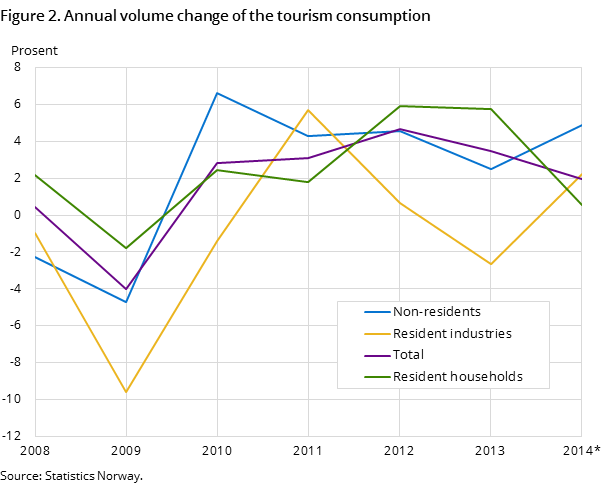
The growth was not equal for the different tourist types. Overall the tourism consumption’s growth in volume was declining from 2011 to 2014, from an annual growth in 2012 of 4.7 per cent to 2 per cent in 2014. In 2014, the non-resident tourists contributed with 66 per cent of the growth, whereas the remaining increase was relatively evenly split between the Norwegian households and the Norwegian industries.
The relations between the various tourist types and their development from 2007 to 2014 are illustrated in figure 1 and 2.
Norwegians are changing how they organise their holidays
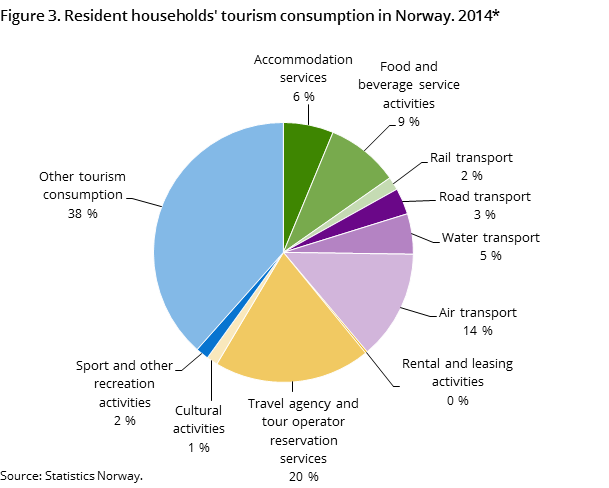
The low growth in the resident households’ tourism consumption in Norway in 2014 can partly be explained by the decrease in purchases of outbound package holidays. Instead, many have made individual trips abroad. As purchases of tour operator services constitute almost a sixth of the Norwegian households’ tourism consumption in Norway, the results in the tourism satellite accounts are affected when the households change the way they organise their holiday abroad. Figure 3 illustrate what goods and services the Norwegian households consumed in 2014 in Norway.
When going on a package holiday purchased from a Norwegian tour operator, this is considered in its entirety as one single service which is delivered and consumed in Norway. Whereas for individual trips only the parts of the services that are consumed in Norway and for travelling to and from the country, are included in the Norwegian tourism consumption. Accommodation in for example Spain, is thus when included in a package holiday also included in the tourism consumption in Norway, but if one purchases the components separately, the hotel accommodation abroad will be a part of the Norwegian households’ consumption expenditures abroad. The tourism satellite accounts do not encompass the consumption expenditures abroad. With a shift from package holidays to individual trips, some of the tourism consumption is simultaneously moved from tour operator services to air passenger services, where planes are the chosen mode of travel.
Highest growth in output in the tourism industries
When assessing the significance of tourism, it is useful to analyse the industries producing tourism products, and to compare these with the overall economy.
The output in the tourism industries in 2014, are estimated to more than NOK 250 billion. Measured in volume, the output growth in the years 2011-2014 was above 8 per cent. This is similar to the growth in Mainland Norway. The tourism industries’ share of the total output in Mainland Norway was 5.7 per cent in 2014.
The value added in the tourism industries are estimated to a good NOK 100 billion in 2014. Measured in volume this is a good 6 per cent growth from 2011 to 2014. This was about 2 percentage points lower that the growth in the overall value added in Mainland Norway.
Employment measured in full-time equivalents had a weaker growth than both output and value added, and it is estimated to 3.9 per cent from 2011 to 2014. The employment increased the most in the food serving services. 2 out of 3 new man-years are found in this industry.
Tourism most important in Sogn & Fjordane, Troms and Oslo
As an element in the tourism satellite accounts, output, value added and employed persons in the tourism industries have been computed for each county. The calculations are made for the reference year 2013, as this is the most recent year available for the regional accounts that form the basis for these calculations.
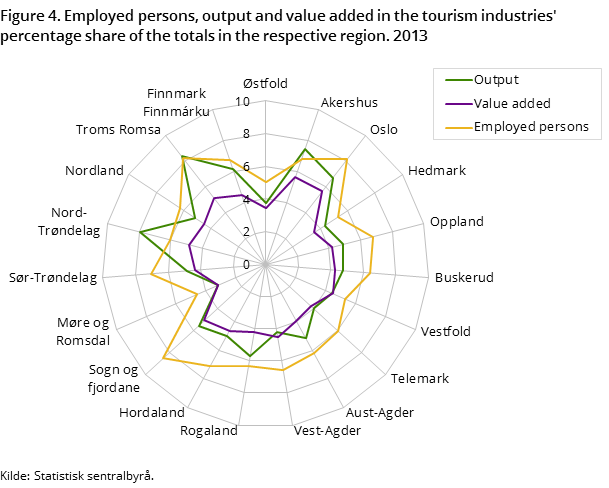
Measured in the number of employed persons, it is Sogn & Fjordane, Troms and Oslo that have the most people employed in the tourism industries compared with the total employed in the respective county. In all three counties, more than 8 per cent of all people employed worked in the tourism industries.
The same counties are also heading the list together with Akershus, when looking at the tourism industries’ contribution towards the Norwegian value added. The contributions from these four counties were all above 5 per cent.
The shares are illustrated in figure 4.
Half of the employed people in the tourism industries in 2013, as in 2011, worked in Oslo, Akershus, Rogaland and Hordaland. An ever higher share of the output and the value added in the tourism industries came from the same four counties. Almost 6 out of NOK 10 was produced and earned there.
Revised national accounts
In 2014, Statistics Norway published revised national accounts for the years 1970-2013. The main reason for the revision was changes in the international guidelines for national accounts. Simultaneously, new information and new methods were incorporated.
This revision had consequences for other accounts that are based on the national accounts like the regional accounts and the tourism satellite accounts.
The tourism satellite accounts compiled in this round include results based on the newest guidelines from 2011 onwards. For year 2011, a revised version is made to have figures for a bridging reference year from both before and after the main revision in 2014. This can aid the users when comparing time series beyond the break. The main changes are described below.
The tourism consumption has not been revised, but its significance in relative terms compared to the overall economy, has changed marginally.
The revision has affected the overall Norwegian economy and the tourism industries more. Several cultural institutions, like museums and theatres, have been moved from public non-financial corporations to general government. This has lead to improved data sources, and output, value added and employment in the cultural services have been revised up by around 30 per cent.
The output in the tourism industries in total has been revised down by 0.9 per cent, and the output of tourism products is revised down by 2.1 per cent compared with the former results. The share of the output in the tourism industries compared with the output in Mainland Norway has been revised down by 0.2 percentage points to 5.8 per cent.
Employment and value added in the tourism industries in 2011 are revised up by 2.5 and 4.8 per cent respectively.
Contact
-
Anne Mari Auno
E-mail: anne.auno@ssb.no
tel.: (+47) 40 90 26 11
