Wastewater statistics ‘mapped out’
Published:
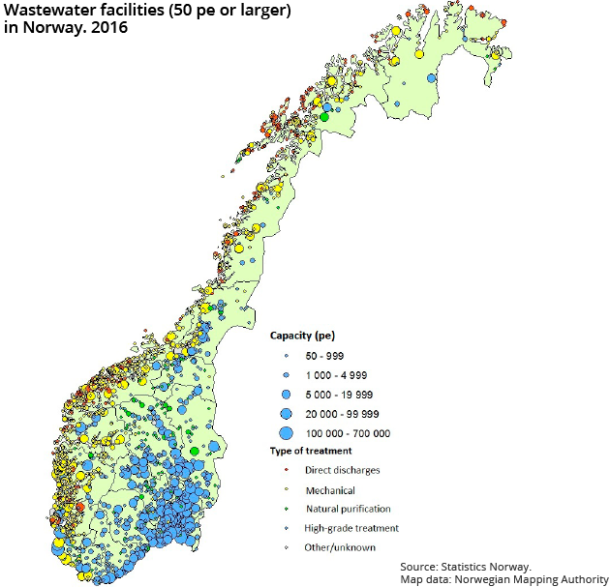
Statistics Norway has attempted to create a simplified map of the country’s wastewater facilities. The visualisation shows the divide between the predominantly high-grade chemical and/or biological treatment in the east of the country and the Trøndelag region and more mechanical treatment in the rest of the country.
- Full set of figures
- Municipal wastewater
- Series archive
- Discharges and treatment of municipal waste water (archive)
The map is shown below and includes wastewater facilities of 50 person equivalents (pe) or more, according to updated figures from Discharges and treatment of municipal waste water.
The map also shows natural purification plants in the inner eastern parts of the country (e.g. Hedmark and Oppland) and that there are dispersed direct discharges along the coast, from western Norway up to Finnmark in the north.
55 per cent compliance with treatment permits
Compliance with treatments permits represents an important ‘constraint’ in running a wastewater facility. The statistics show that 55 per cent of the 4.5 million people connected to a wastewater facility (50 per or more) are linked to a facility that complies with their treatment permits in 2016. Furthermore, 33 per cent do not comply, and compliance was unknown for 12 per cent (due to missing data).
Figure 2. Compliance with treatment permits for inhabitants connected to large wastewater facilities (50 pe or more). By county. 2016. Inhabitants connected
| Compliance with treatment permits unknown | Non-compliance with treatment permits | Compliance with treatment permits | |
| Finnmark Finnmárku | 12871 | 20538 | 29023 |
| Troms Romsa | 13491 | 53919 | 70258 |
| Nordland | 62156 | 34920 | 83135 |
| Nord-Trøndelag | 8509 | 53210 | 46434 |
| Sør-Trøndelag | 10442 | 91486 | 156894 |
| Møre og Romsdal | 79514 | 24234 | 104119 |
| Sogn og Fjordane | 11476 | 21930 | 39071 |
| Hordaland | 134915 | 171079 | 103322 |
| Rogaland | 46437 | 304507 | 61908 |
| Vest-Agder | 1182 | 92222 | 64699 |
| Aust-Agder | 18221 | 10864 | 70534 |
| Telemark | 31984 | 86447 | 27981 |
| Vestfold | 635 | 106029 | 115487 |
| Buskerud | 5499 | 84478 | 140446 |
| Oppland | 791 | 69622 | 68403 |
| Hedmark | 8998 | 28175 | 98732 |
| Akershus og Oslo | 75825 | 79052 | 1102752 |
| Østfold | 269 | 151563 | 116381 |
Three out of five connected to high-grade treatment
In 2016, 62 per cent of Norway’s population was connected to high-grade treatment plants – biological and/or chemical treatment.
Figure 3. Share of the population connected to various types of treatment plants. By county. 2016
| Individual treatments plants - direct discharges | Individual treatments plants - other treatment | Individual treatments plants - septic waste collection | Individual treatments plants - mini wastewater treatment plant | Wastewater facilities with direct discharges | Mechanical, natural purification or other types of treatment | Advanced treatments plants | |
| Finnmark Finnmárku | 1917 | 36 | 12401 | 104 | 17258 | 39358 | 5816 |
| Troms Romsa | 9051 | 4 | 35767 | 143 | 6867 | 125212 | 5589 |
| Nordland | 6526 | 537 | 68952 | 673 | 34660 | 141495 | 4056 |
| Nord-Trøndelag | 302 | 3593 | 29087 | 1000 | 85 | 35327 | 72741 |
| Sør-Trøndelag | 722 | 171 | 45056 | 1924 | 1523 | 220471 | 36828 |
| Møre og Romsdal | 3228 | 180 | 58035 | 288 | 20841 | 172079 | 14947 |
| Sogn og Fjordane | 2792 | 17 | 37455 | 313 | 3304 | 52930 | 16243 |
| Hordaland | 2274 | 250 | 87797 | 3856 | 11408 | 199364 | 198544 |
| Rogaland | 1566 | 152 | 41443 | 1942 | 16840 | 121472 | 274540 |
| Vest-Agder | 298 | 97 | 20338 | 1734 | 0 | 17262 | 140841 |
| Aust-Agder | 578 | 121 | 20651 | 1851 | 0 | 82 | 99537 |
| Telemark | 464 | 316 | 28361 | 1389 | 0 | 517 | 145895 |
| Vestfold | 40 | 64 | 26897 | 2962 | 0 | 340 | 221811 |
| Buskerud | 78 | 197 | 38655 | 1866 | 0 | 1985 | 228438 |
| Oppland | 44 | 823 | 68135 | 878 | 0 | 1923 | 136893 |
| Hedmark | 646 | 203 | 58094 | 1402 | 0 | 8007 | 127898 |
| Akershus and Oslo | 617 | 3573 | 34201 | 13497 | 0 | 5 | 1257624 |
| Østfold | 53 | 357 | 17535 | 10686 | 0 | 366 | 267847 |
| Rest of the country | 28378 | 4940 | 415993 | 10243 | 112786 | 1107708 | 629304 |
| North Sea Counties | 2818 | 5751 | 312867 | 36265 | 0 | 30487 | 2626784 |
| The whole country | 31196 | 10691 | 728860 | 46508 | 112786 | 1138195 | 3256088 |
High-grade treatment plants have the ability to remove far more of the pollutants from the wastewater before being discharged into rivers and water systems than mechanical treatment plants. This applies in particular to phosphorous and organic material, but also other types of pollutants.
Furthermore, the statistics show that 22 per cent of the population was connected to mechanical or other types of treatment, 2 per cent had direct discharges and the remaining 14 per cent of the population were connected to small wastewater facilities (less than 50 pe).
1 014 tonnes of phosphorous in 2016
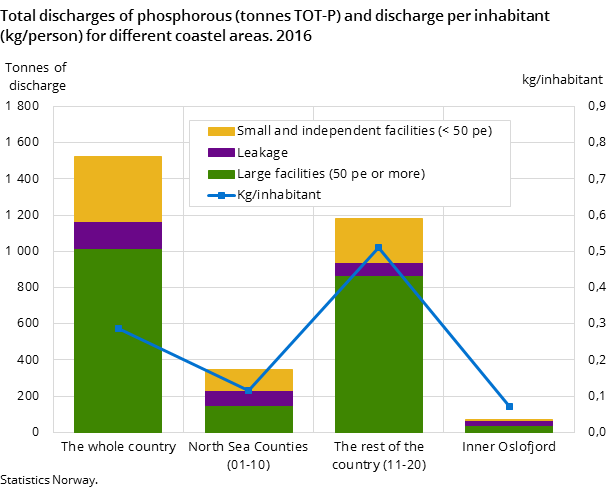
For 2016, the discharges of phosphorous (TOT-P) from municipal facilities of 50 pe or more have been estimated at 1 014 tonnes. Per inhabitant connected, this discharge corresponds to 0.23 kg phosphorous per year.
When estimations of leakage from the pipeline system (150 tonnes) and discharges from small independent wastewater facilities (360 tonnes) are also added, the total figure is around 1 530 tonnes for the whole wastewater sector. In comparison, Statistic Norway’s fertiliser survey (in Norwegian only) shows that a total of 15 200 tonnes of phosphorous in the form of inorganic fertiliser and manure was applied to agricultural areas in Norway in 2013. Thus, in a ‘resource perspective in an ideal world’ the wastewater sector could potentially cover around 10 per cent of the phosphorous demand in the agricultural sector.
In 2016, the phosphorous treatment efficiency of the wastewater sector as a whole has been estimated at 67 per cent of the incoming amount. However, there is a big regional variety, and treatment efficiencies are generally higher in counties on the eastern part of the country and in the Trøndelag area, where treatment permits are stricter and recipient capacity is somewhat lower (more sensitive to pollution).
4.8 per cent increase in costs of wastewater services
In 2016, the total cost for all municipalities was NOK 7.3 billion. This constitutes an increase of 4.8 per cent compared to 2015. The costs related to the wastewater sector are made up of capital costs and operating costs, and the increase mentioned is due to an increase in both operating and capital costs.
Figure 5. Distribution among municipalities of contribution margin ratio and full cost ratio. 2016
| Contribution margin ratio | Full cost ratio | |
| Data missing | 6 | 6 |
| 0 - 70 | 5 | 2 |
| 71 - 90 | 18 | 5 |
| 91 - 100 | 24 | 86 |
| 101 - 110 | 23 | 0 |
| 111 - 120 | 12 | 0 |
| 121 - 130 | 7 | 0 |
| More than130 | 5 | 0 |
Wastewater fees are determined by the municipalities in accordance with the full cost principle. Local conditions such as patterns of built-up areas, topography, bedrocks in the ground, the need for pumping stations and treatment requirements are all factors behind the variation in fees.
Around 51 per cent of the population live in municipalities with a contribution margin ratio of more than 100 per cent, which means that the incomes from fees are higher than the fee calculation basis. At the same time, a total of 86 per cent of the municipalities have a full cost ratio between 91 and 110 per cent, and these municipalities are home to 96 per cent of the population. Thus, a major part of the population lives in municipalities where the costs for wastewater services are covered by fees. The municipality may then use the surplus to fund provisions or cover earlier deficits.
Contact
-
Gisle Berge
-
Statistics Norway's Information Centre


