Content
Published:
This is an archived release.
Emissions of ammonia and NOx exceed emission obligations
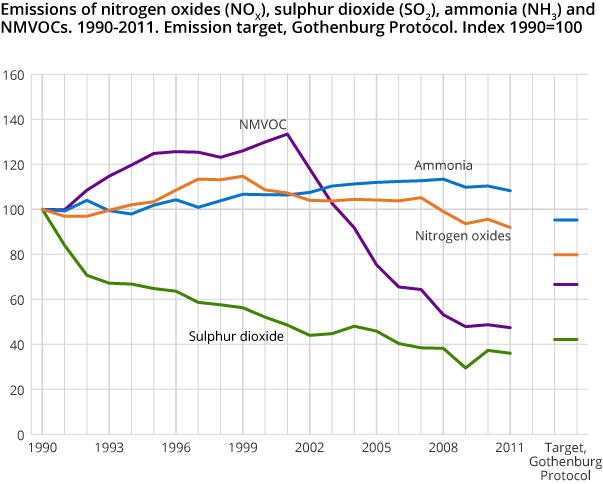
New estimations of emissions from agriculture show a considerable increase in the emissions of ammonia compared to previous estimations, and emissions are well above the ceiling level in the Gothenburg protocol. NO X emissions also exceed the obligations in the protocol.
| 2011 | Change in per cent | ||
|---|---|---|---|
| 1990 - 2011 | 2010 - 2011 | ||
| Nitrogen oxides (NOX) | 180 | -8.0 | -3.8 |
| Sulphur dioxide (SO2) | 19 | -63.9 | -3.4 |
| Ammonia (NH3) | 26 | 8.3 | -1.9 |
| Non-methane volatile organic compounds (NMVOC) | 139 | -52.6 | -2.7 |
| Carbon monoxide (CO) | 311 | -58.3 | -8.0 |
The new estimations for 2011 are now available for nitrogen oxides (NO X ), sulphur dioxide (SO 2 ), ammonia (NH 3 ), non-methane volatile organic carbon (NMVOC) and carbon monoxide (CO). The new estimations confirm previous trends, but there are significant changes in emission levels, particularly concerning ammonia.
According to the Gothenburg Protocol, ammonia emissions are not to exceed 23 000 tonnes per year. Previous estimations were just below this level. In 2012, adjustments were made to the estimates of emissions from agriculture (see box below), and this resulted in an upward shift in estimated emissions from agriculture, ranging from 6 to 24 per cent in the time series 1990-2011. In 2011, NH 3 emissions totalled 26 200 tonnes, which is 14 per cent above the ceiling level. Agriculture is the source of 91 per cent of the ammonia emissions in Norway.
Reduced emissions of NO X from transport
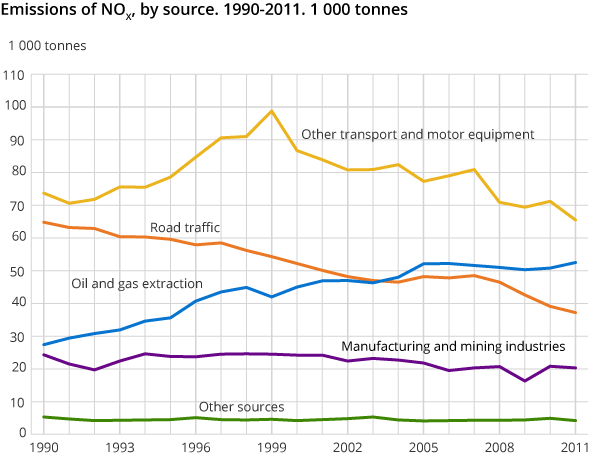
The total emission of NO X has been reduced by 8 per cent since 1990. Transport emission is down as much as 26 per cent, with road traffic contributing the most to this reduction. Emissions from coastal navigation have been reduced by almost 20 per cent since 2008. This is partly due to measures implemented by the NO X Fund, which is financed by industry and businesses. Energy use in coastal navigation has not had the same decrease.
Road traffic was the source of 21 per cent of total NO X emissions in 2011. Other transport, including navigation, aviation and motorized equipment, was responsible for 36 per cent of the emissions, while oil and gas extraction constituted 29 per cent of total NO X emissions.
Reduced SO 2 emissions from manufacturing and transport
The SO 2 emissions in Norway have been reduced by 64 per cent since 1990, with a 66 per cent reduction in emissions from manufacturing. This has been achieved by pollution control, the closure of pollution-generating businesses and a reduced consumption of petroleum products. The total reduction from transport is 70 per cent from 1990, which is mainly due to less sulphur in the fuels. Most of the reduction took place at the beginning of the period.
Manufacturing and mining are still the largest sources of emissions, and together constituted 67 per cent of total emissions in 2011. Transport was responsible for 17 per cent of the SO 2 emissions.
NMVOC emissions greatly reduced
The emissions of NMVOC have been more than halved since 1990, and since the peak in 2001, emissions are down by two thirds. Loading of crude oil offshore was the main reason for the increase in emissions from 1990 to 2001. Measures to prevent these emissions have resulted in a decrease of 90 per cent from 2001 to 2011. Total emissions are now well below the target level in the Gothenburg Protocol.
Acidifying emissions are down
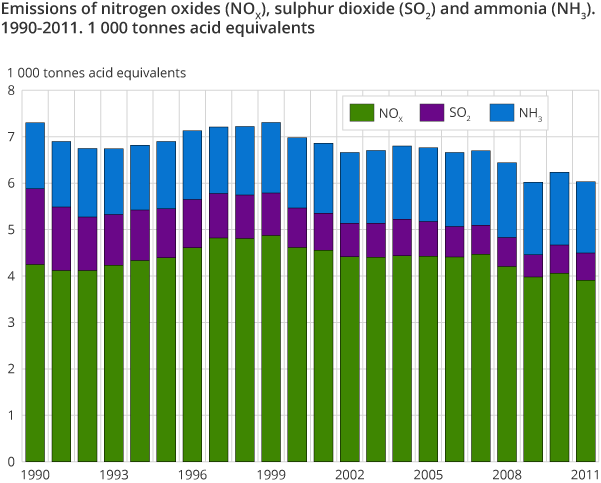
Emission of gases that transform into acid can be expressed in terms of acid equivalents . Total emissions of the three gases NO X , SO 2 and NH 3 measured as acid equivalents have been reduced by 17 per cent since 1990. SO 2 and NO X emissions are down 64 and 8 per cent respectively, while NH emissions have increased by 8 per cent. In 2011, NOx constituted 65 per cent of the acidifying emissions, while NH 3 and SO 2 were responsible for 25 and 10 per cent of these emissions respectively.
The Gothenburg Protocol and National Emissions Ceiling directive (NEC)Open and readClose
The Gothenburg Protocol, which entered into force in 2005, sets limits on emissions of sulphur dioxide (SO2), volatile organic compounds (VOCs), ammonia (NH3) and nitrogen oxides (NOx). A revised protocol was passed in May 2012. The countries have an obligation to keep emissions below the levels of 2010. In addition, new obligations for 2020 were set, and PM2.5 was also included.
Norwegian emission ceilings in the Gothenburg Protocol:
SO2: 22 000 tonnes
NOX: 156 000 tonnes
NH3: 23 000 tonnes
NMVOC: 195 000 tonnes
This agreement is now being revised. In the EU directive 2001/81/EF (NEC), which through the EEA agreement also applies to Norway, the countries are committed to the same obligations.
Source: http://www.environment.no/
Adjustments to the emission inventoryOpen and readClose
General updates
Updates in activity data and emission factors have resulted in changes in the level of emissions for several components. For NMVOC and NH3 emissions, the whole time series 1990-2010 has been revised upward compared to previously published figures. CO and NOX emissions have been revised upward for most of the years, while SO2 is adjusted down for 2008 and 2009 and up for 2010. The most significant changes are due to quality improvements in the emission estimates for agriculture and road traffic:
Agriculture
The total ammonia emissions are revised upward for the whole time series, varying between 6 and 21 per cent in the different years. There are two major improvements in the estimations: first, new factors for annual excretion of nitrogen in manure and urine from domestic animals have been updated in a research project at the Norwegian University of Life Sciences. This has resulted in an increase in estimated emissions varying between 1 000 and 4 300 tonnes of NH3 per year in the time series. Second, NH3 emissions from the use of sewage sludge in agriculture have been included in the inventory. This has led to an increase in NH3 emissions varying between 100 and 500 tonnes per year.
Road traffic
A correction in the link between vehicle population and driving distances has been implemented so that total estimated driving distance corresponds to the total driving distance in the statistics of road traffic volumes. This has led to an increase in total estimated mileage of 5-6 per cent in the years from 2005 to 2011. Emissions have increased correspondingly. In addition, an error in the estimations of mileage for lorries has been corrected. This has given a significant upward revision of the emissions of NOX, particularly for the years 1990-1992.
About the emission inventoryOpen and readClose
Statistics on emissions to air are now available with detailed subdivisions by industry and source, and include figures for 2011. The statistics subdivided by industry are used in the reporting of environmental accounts to Eurostat. The statistics subdivided by source are used as a basis for reporting on greenhouse gasses, long-range transboundary air pollution, hazardous substances and heavy metals.
The emission inventory is prepared and published by Statistics Norway, with contributions by the Climate and Pollution Agency (Klif). StatisticsNorwayis responsible for compilation of the statistics and for supplying most of the activity data. Klif contributes in particular to the development of methodology, emission factors and emission data from major point sources.
Read more about documentation of the emission inventory , (an updated version will be published in July 2013).
The statistics is published with Emissions to air.
Contact
-
Statistics Norway's Information Centre
E-mail: informasjon@ssb.no
tel.: (+47) 21 09 46 42


