Content
Published:
This is an archived release.
Reduced emissions from loading of crude oil
Emissions of non-methane volatile organic compounds (NMVOCs) decreased by 11 per cent in 2002. Nitrogen oxides (NOX) were reduced by 3 per cent in the same period.
These are some of the results of the preliminary calculations for 2002 from Statistics Norway and the Norwegian Pollution Control Authority.
NMVOC emissions reduced
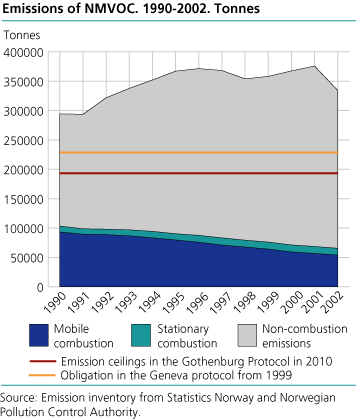
The calculations show emissions of 334 000 tonnes NMVOCs in 2002, which is 11 per cent lower than the year before. This is due to lower oil production that leads to smaller amounts of crude oil loaded offshore, and the fact that recovery facilities for oil vapour have been installed. Decrease in petrol sales and more cars with catalytic converters give further reduction in the emissions.
More than 50 per cent of Norway's NMVOC emissions come from evaporation during loading and storing of crude oil offshore. 19 per cent of the emissions come from solvents and petrol engines. Emissions from petrol engines were reduced by 10 per cent during 2001.
The positive trend must continue in the future if Norway shall meet the emission target set in the Gothenburg Protocol, 195 000 tonnes in 2010.
Emissions of nitrogen oxides reduced
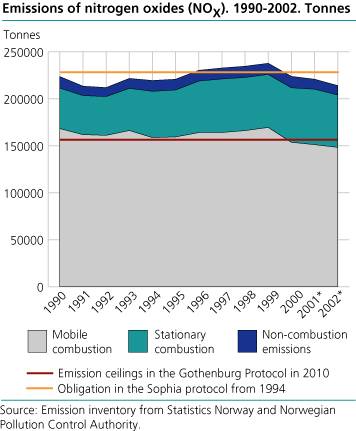
In 2002, the emissions of nitrogen oxides were reduced by 3 per cent compared with 2001. The sources that contribute most to the decrease are road traffic, oil and gas activities and process industry.
NOX emissions have been reduced in spite of the rise in car traffic. This is due to a rise in use of catalytic converters.
Reduction in flaring of natural gas offshore during the last year has led to lower NOX emissions.
So has reduced activity because of problems in parts of the process industry. ( See article about greenhouse gas emissions ).
In some areas, however, NOX emissions are increasing. The growth in use of natural gas for production of electricity on oil platforms contributes to increased emissions.
Shipping and fishing vessels, road traffic and oil and gas activities are the main sources of NOX emissions, with 39, 22 and 20 per cent respectively in 2001.
According to the Gothenburg Protocol, Norway must reduce their NOX emissions by 27 per cent by 2010.
|
Emission ceilings in 2010 according to the Gothenburg protocol.
Status 2002. Tonnes (per cent) |
| Component | Emissions 1990 | Emissions 2002 | Emission ceiling 2010 | Necessary reduction 2002-2010 | |||||||||||||||||||||||||||||||||||
|---|---|---|---|---|---|---|---|---|---|---|---|---|---|---|---|---|---|---|---|---|---|---|---|---|---|---|---|---|---|---|---|---|---|---|---|---|---|---|---|
| NOX | 223 523 | 213 972 | 156 000 | 58 000 tonnes (27 per cent) | |||||||||||||||||||||||||||||||||||
| NMVOC | 294 393 | 334 422 | 195 000 | 139 000 tonnes (42 per cent) | |||||||||||||||||||||||||||||||||||
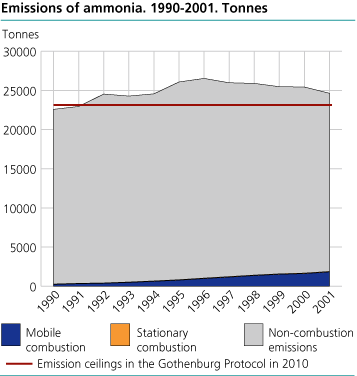
Ammonia emissions for 2002 are not ready yet
These figures will be published together with SO2 emissions in June 2003.
More new figures
See the last article about greenhouse gas emissions here . Emission figures for municipalities -greenhouse gases, acidifying gases and particulate matter - in 2000, presented 21 March, can be downloaded here . In February, new figures for emissions of hazardous substances in Norway were presented. ( Emission to air of persistent organic pollutants and heavy metals, 1990-2001 ).
See more figures about emissions to air in StatBank .
The statistics is published with Emissions to air.
Contact
-
Statistics Norway's Information Centre
E-mail: informasjon@ssb.no
tel.: (+47) 21 09 46 42


