Content
Published:
This is an archived release.
Challenging NO X target
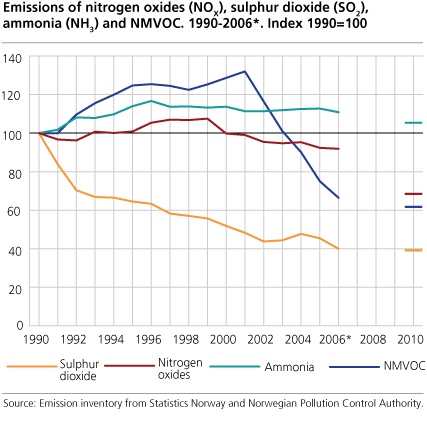
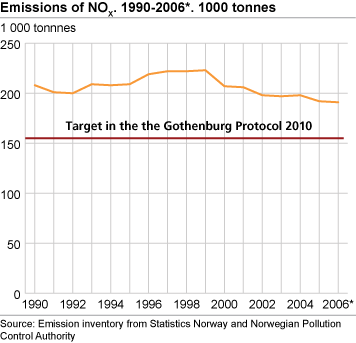
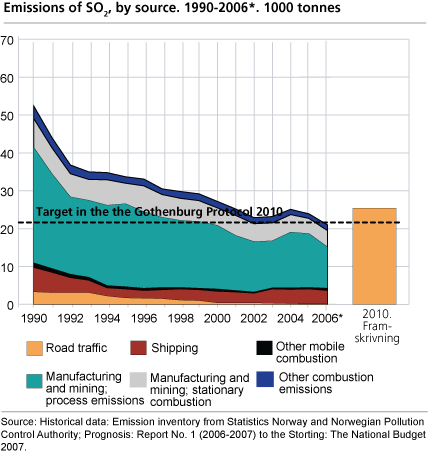
In 2006, emissions of nitrogen oxides (NOX) amounted to 191 000 tonnes. The emissions must be reduced by 18 per cent by 2010 to fulfil Norway’s international commitments. For the first time, in 2006, the missions of SO2 were lower than the emission targets in the Gothenburg Protocol. For NMVOC, the emission target is within reach due to imposed environmental measures.
This appears from the Norwegian emission inventory, which is produced by Statistics Norway in collaboration with the Norwegian Pollution Control Authority.
| Component | Emissions 1990 | Emissions 2006* | Emission ceiling 2010 | Necessary reduction 2006-2010 | |||||||||||||||||||||||||||||||||||
|---|---|---|---|---|---|---|---|---|---|---|---|---|---|---|---|---|---|---|---|---|---|---|---|---|---|---|---|---|---|---|---|---|---|---|---|---|---|---|---|
| Nitrogen oxides (NOX) | 207 712 | 190 755 | 156 000 | 35 000 tonnes (18 per cent) | |||||||||||||||||||||||||||||||||||
| Sulphur dioxide (SO2) | 52 388 | 20 939 | 22 000 | Emission ceiling appr. reached at the moment | |||||||||||||||||||||||||||||||||||
| NMVOC | 295 280 | 196 132 | 195 000 | 1 000 tonnes (0.6 per cent) | |||||||||||||||||||||||||||||||||||
| Ammonia (NH3) | 20 375 | 22 580 | 23 000 | Emission ceiling appr. reached at the moment | |||||||||||||||||||||||||||||||||||
| Source: Emission inventory from Statistics Norway and Norwegian Pollution Control Authority. |
Far away from NOX target
The Norwegian NOX emissions amounted to 191 000 tonnes in 2006, a decrease of 0.5 per cent from 2005. Since 1990, the emissions have been reduced by 8 per cent. The introduction of exhaust gas restrictions in 1990 is the main driving force behind the reductions. However, the emissions must be reduced by a further 18 per cent, or 35 000 tonnes, if Norway is to meet the obligation of 156 000 tonnes in the Gothenburg Protocol.
The three emission sources domestic sea transport and fishing, oil and gas activities and road traffic together accounted for 78 per cent of the NOX emissions in 2006. The remainder mainly came from the manufacturing industry, motorised equipment and domestic air traffic.
Domestic sea transport and fishing was the largest source of NOX emissions in 2006, accounting for 64 000 tonnes or 34 per cent of the total. These emissions have increased considerably since 1990, and are now 11 per cent above the 1990 level. Slightly more than a third of the emissions from this source originate from fishing. The rest comes from coastal traffic, ferries, speedboats, supply ships and mobile oil rigs by transfer etc.
Oil and gas activities accounted for 51 000 tonnes or 27 per cent of the NOX emissions in 2006. As for domestic sea transport and fishing, this is an important emission source, not only because of substantial emissions, but also because the emissions have grown considerably since 1990. The emissions from oil and gas activities have increased with 72 per cent since 1990. Possible measures to reduce these emissions are low-NOX turbines (Dry Low Emission - DLE), for instance.
NOX tax and NOX agreementOn 1 January 2007, the Storting introduced a NOX tax at NOK 15 per kg NOX emitted. The tax applies to emissions from ships, fishing vessels, air traffic and diesel railways, engines, boilers and turbines in energy plants in the manufacturing industry both onshore and offshore. In addition, the tax is imposed on flaring offshore and oil and gas installations onshore. In January 2008, a NOX agreement was signed between the Government and 14 trade associations. Companies that endorse the agreement do not have to pay NOX tax for three years. The members of the trade associations have committed themselves to reduce their emissions by 31 000 tonnes in total by the end of 2011. This will be met by implementing emission-reducing measures. First and foremost the agreement is expected to trigger off comprehensive measures for ship traffic and the fishing fleet, but is also concerned with the manufacturing industry both onshore and offshore. It is not possible to see the effects of the NOX tax until the preliminary emission figures for 2007 are published in May this year. The effects of the NOX agreement may become apparent in the statistics published in May 2009. |
Effective measures to reduce NMVOC emissions
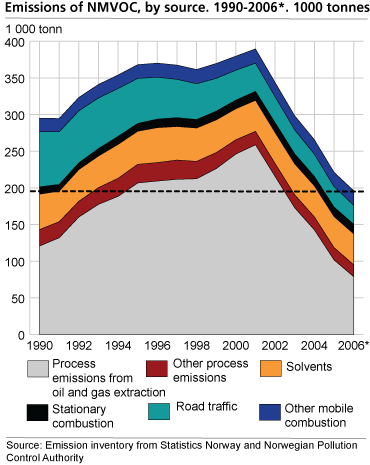
According to the Gothenburg Protocol, the emissions of NMVOC (non-methane volatile organic compounds) must be reduced to 195 000 tonnes from 2010. In 2006, the emissions were slightly over 196 000 tonnes. This is 11 per cent lower than in 2005, mainly due to the Norwegian Pollution Control Authority’s decision that loading and storing of crude oil on the continental shelf must take place using technology that reduces NMVOC emissions.
Emissions of NMVOC from road traffic have also fallen considerably. This is due to exhaust gas restrictions and an increase in the number of diesel cars, which have much lower NMVOC emissions than petrol cars.
SO2 and ammonia below the emission targets
The emissions of sulphur dioxide (SO2) was about 21 000 tonnes in 2006. The emissions have been reduced by 12 per cent since 2005. This is the first time the emissions are below the 2010 target of 22 000 tonnes in the Gothenburg Protocol. Reductions in emissions from the ferroalloy industry, which is an important emission source, have contributed to the positive development. The emissions from the coastal traffic have also been reduced.
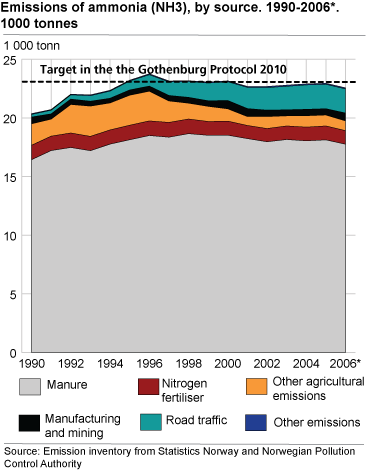
The emissions of ammonia were almost 23 000 tonnes in 2006, which corresponds to the target in the Gothenburg Protocol for 2010. The emission level has been relatively stable for this gas during the last years.
Recalculations
According to guidelines for reporting emission data, the Norwegian emission inventory is recalculated every year for every year back to 1990 in order have as consistent time series as possible. New knowledge about emission factors, activity data, new emission sources or improved calculation methods are also taken into account. Due to new data, the emissions of NOX from flaring have been reduced considerably since the last publication. The emissions in 2006 are 4 300 tonnes lower than calculated using the previous method.
Other emission statistics published today
Lower GHG emissions in 2005 and 2006
Reduced emissions of hazardous substances
Documentation of the emission accounts
The Norwegian Emission Inventory. Documentation of methodologies for estimating emissions of greenhouse gases and long-range transboundary air pollutants ( Rapport 2007/38 )
Tables:
The statistics is published with Emissions to air.
Contact
-
Statistics Norway's Information Centre
E-mail: informasjon@ssb.no
tel.: (+47) 21 09 46 42

