Content
Published:
This is an archived release.
NOx emissions down 2 per cent
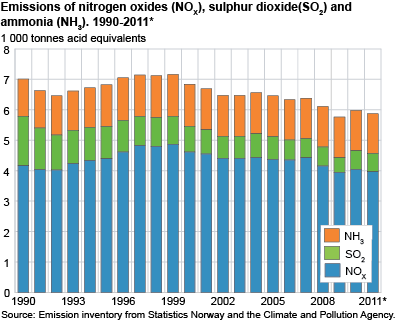
Norway’s emissions of NOX were reduced by 2 per cent in 2011 compared to the previous year. Emissions of SO2, NH3, NMVOC and CO also decreased between 2010 and 2011.
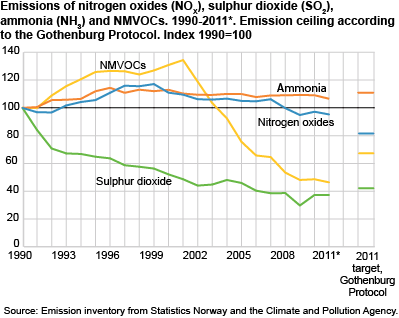
The total emissions of acidifying substances were reduced by 2 per cent between 2010 and 2011. The decline was mainly due to a 2 per cent reduction in emissions of NOX, equivalent to around 4 000 tonnes. The NH3 emissions also decreased by approximately 2 per cent, to about 22 000 tonnes. The emissions of SO2 were almost unchanged compared to 2010, at nearly 19 500 tonnes.
After a small increase between 2009 and 2010, emissions of NMVOC declined once more in 2011. The emissions of NMVOC were reduced by nearly 5 per cent, while the emissions of CO declined by 2 per cent.
The Norwegian emission inventory is compiled by Statistics Norway in collaboration with the Climate and Pollution Agency.
| Gas |
Emissions from
Norwegian territory |
Emissions releated to the emission
ceiling of the Gothenburg Protocol |
Emission ceiling | Fulfilment | Harmful effects | ||||||||||||||||||||||||||||||||||||||||||||||||||||||||||||||||||||||||||
|---|---|---|---|---|---|---|---|---|---|---|---|---|---|---|---|---|---|---|---|---|---|---|---|---|---|---|---|---|---|---|---|---|---|---|---|---|---|---|---|---|---|---|---|---|---|---|---|---|---|---|---|---|---|---|---|---|---|---|---|---|---|---|---|---|---|---|---|---|---|---|---|---|---|---|---|---|---|---|---|
| Nitrogen oxides (NOX) | 182 | 181 | 156 | 16 per cent above the limit | Increase the risk of respiratory disease (particularly NO2). Contribute to acidification, corrosion, formation of ground-level ozone and eutrophication. | ||||||||||||||||||||||||||||||||||||||||||||||||||||||||||||||||||||||||||
| Sulphur dioxide (SO2) | 19 | 19 | 22 | Emission target achieved | Increases the risk of respiratory complaints. Acidifies soil and water and causes corrosion. | ||||||||||||||||||||||||||||||||||||||||||||||||||||||||||||||||||||||||||
| Ammonia (NH3) | 22 | 20 | 23 | Emission target achieved | Contributes to acidification of water and soils, and eutrophication. | ||||||||||||||||||||||||||||||||||||||||||||||||||||||||||||||||||||||||||
| NMVOCs | 134 | 134 | 195 | Emission target achieved | May include carcinogenic substances. Contribute to formation of ground-level ozone. | ||||||||||||||||||||||||||||||||||||||||||||||||||||||||||||||||||||||||||
| CO | 327 | Not relevant | - | No quantified emission ceiling | Increases risk of heart problems in people with cardiovascular diseases. | ||||||||||||||||||||||||||||||||||||||||||||||||||||||||||||||||||||||||||
| 1 | The official figures from Statistics Norway are the emissions from the Norwegian territory. Figures reported under the Gothenburgh Protocol are delimited a little different within air transport than the figures for emissions from Norwegian territory. . |
| Source: Emission inventory from Statistics Norway and the Climate and Pollution Agency. | |
Reduced emissions of NOX from transport
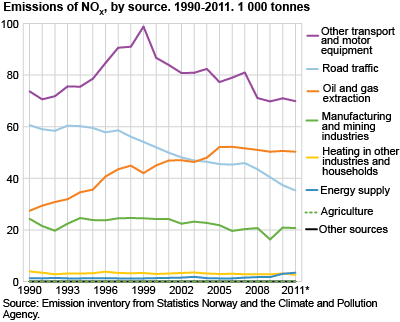
The emissions of NOX went down by about 2 per cent in 2011, with the main reason being lower emissions from road transport. This was primarily due to better technology in heavy duty vehicles after the introduction of stricter exhaust emission requirements. In 2011, emissions from road traffic amounted to somewhat more than 19 per cent of the total NOX emissions. Other transport, including air traffic, navigation and construction machines, was responsible for 38 per cent of the emissions. NOX emissions from other transport were reduced by almost 2 per cent from the preceding year.
Despite last year’s reduction, NOX emissions are still higher than the emission ceiling set in the Gothenburg Protocol . For all the other long range transboundary pollutants covered by the directive, the emissions are below the ceiling set for Norway.
More SO2 from manufacturing industry
The SO2 emissions from the manufacturing industry increased by 2 per cent from 2010 to 2011. This was mainly a consequence of higher activity in manufacturing of iron, steel and ferroalloys. The manufacturing industry is the main source of SO2 emissions in Norway, and was responsible for as much as 70 per cent of the SO2 emissions in 2011.
The use of fuels containing sulphur makes transport other than road traffic an important source of SO2 emissions. Total emissions from air traffic, navigation, fishing and motorised equipment were reduced by almost 5 per cent from 2010 to 2011, mainly because of less use of fuels containing sulphur in ships and boats.
Continued reduction in NH3 from fertilisation
A changeover to fertilisers that cause lower NH3 losses has given further emission reductions. In all, NH3 emissions from agriculture were reduced by 2 per cent in 2011 compared with the previous year. Agriculture was responsible for almost 91 per cent of the total NH3 emissions - most of this came from manure.
Lower NMVOC emissions from extraction of oil and gas
Less offshore loading of crude oil and the ongoing introduction of emission-reducing measures caused a further decrease in NMVOC emissions from extraction of oil and gas in 2011. This source is now responsible for approximately a quarter of the total NMVOC emissions.
For a more detailed description of the time series, see the article on figures 1990-2010 published in February 2012 .
Preliminary figuresThe figures for 2011 presented in this article are preliminary, but still relatively reliable, particularly regarding the total figures. Detailed tables for 2011, including distributions between source and industry, will be published in 2013, together with preliminary figures for 2012. About the emission inventoryRead more about: - Documentation : The Norwegian Emission Inventory. Documentation of methodologies for estimating emissions of greenhouse gases and long-range transboundary air pollutants (Documents 2011/21) |
Tables:
The statistics is published with Emissions to air.
Contact
-
Statistics Norway's Information Centre
E-mail: informasjon@ssb.no
tel.: (+47) 21 09 46 42


