Content
Published:
This is an archived release.
Fewer sand filters, but increasing number of mini wastewater treatment plants
In 2015, there were around 330 000 small wastewater facilities in Norway. Compared to 2002, this is a reduction of around 10 000 facilities, or around 3 per cent. The reduction is most evident among sludge separators with sand filters, which is down 43 per cent from 2002 to 2015.
| 2015 | Per cent | ||
|---|---|---|---|
| 2014 - 2015 | 2011 - 2015 | ||
| Number of wastewater facilities, 50 pe or larger | 2 688 | 0.4 | -1.9 |
| Capacity of wastewater facilities 50 pe or larger (1 000 pe) | 7 055.3 | 1.9 | 3.7 |
| Discharge phosphorus from wastewater facility 50 pe or larger (tonnes TOT-P) | 912.7 | -3.5 | 0.0 |
| Discharge organic material from wastewater facility 50 pe or larger (tonnes BOD5) | 43 751 | -3.3 | . |
| Disposal of sewage sludge to soil improvement (tonnes dry weight) | 110 394 | 6.2 | 20.3 |
| Used in agriculture | 87 606 | 11.9 | 37.2 |
| Used in parks or green spaces | 4 392 | -40.5 | -56.4 |
| Delivered to soil producers | 18 396 | 0.6 | 3.0 |
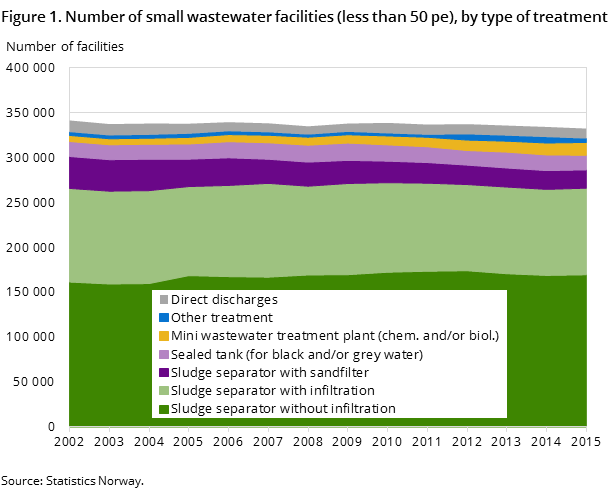
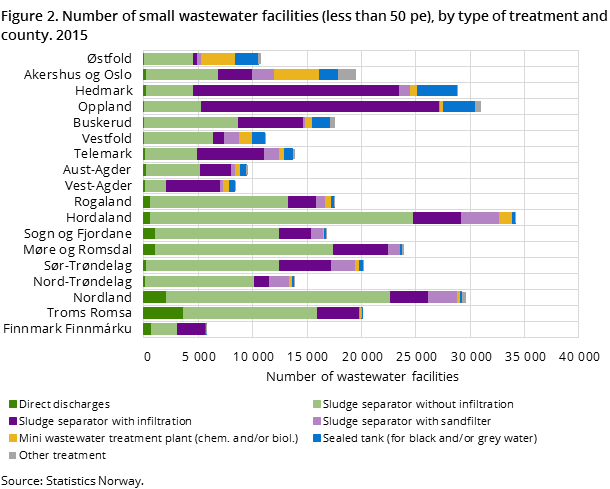
Sludge separators in combination with sand filters has changed from 35 600 to 20 400 facilities over the time period 2002-2015, and this is clearly the type of treatment that is fluctuating the most throughout the time series.
Increasing number of mini wastewater treatment plants
Mini wastewater treatment plants (mini wwtp) constitute another category of small wastewater facility, but while the numbers are still relatively few, the trend shows a growth of nearly 110 per cent over the time period 2002-15. In 2015, there were close to 14 200 mini wwtp in the country, with the largest concentrations surrounding the Oslo fjord, but also more scattered around the country. If properly operated, the mini wwtp can perform just as well as any advanced municipal treatment plants in terms of treatment efficiency.
The statistics on small wastewater facilities describe facilities with a capacity of less than 50 person equivalents (pe). These are normally facilities that cover single houses or small privately owned facilities with joint ownership, and they are commonly located in scattered areas where people are unable to connect to the municipal wastewater pipeline system.
Re-calculation of small wastewater facilities
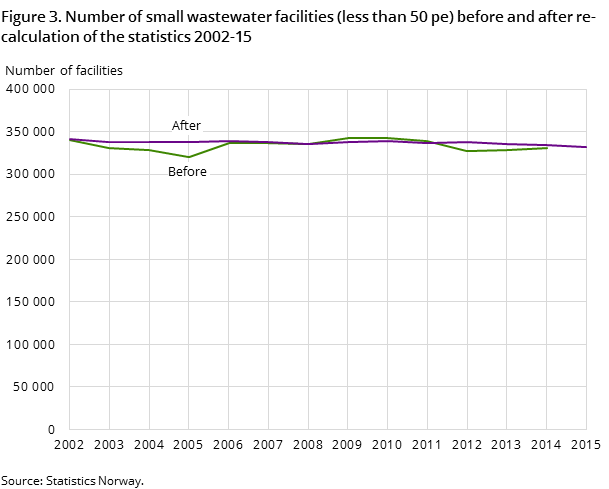
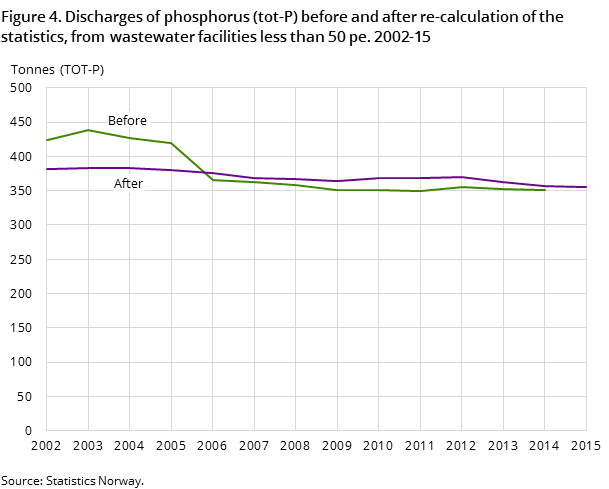
The statistics of small wastewater facilities have been subject to a re-calculation and the time series has been updated for the years 2002-2014. For that reason, the figures may also differ compared to earlier material. Most noticeable is the change in discharge of phosphorous. See figures of statistics before and after the re-calculation and comments in the end of this article about the background for re-calculating the time series.
Three out of five connected to high-grade treatment
In 2015, 65 per cent of Norway’s population was connected to high-grade treatment plants – biological and/or chemical treatment. This constitutes a 3 percentage point increase compared to 2014.
High-grade treatment plants have the ability to remove more of the pollutants from the wastewater before being discharged into rivers and water systems compared to mechanical treatment plants. This applies in particular to phosphorous and organic material, but also other types of pollutants.
Furthermore, the statistics show that 18 per cent of the population was connected to mechanical or other types of treatment, 2 per cent had direct discharges and the remaining 15 per cent of the population were connected to small wastewater facilities (less than 50 pe).
915 tonnes of phosphorous in 2015
For 2015, the discharges of phosphorous (TOT-P) from municipal facilities of 50 pe or more have been estimated at 915 tonnes. This constitutes a 3 per cent decrease compared to the year before. Per inhabitant connected, this discharge corresponds to 0.20 kg phosphorous per year.
When estimations of leakage from the pipeline system (150 tonnes) and discharges from small independent wastewater facilities (355 tonnes) are also added, the total figure is around 1 420 tonnes for the whole wastewater sector. In comparison, Statistic Norway’s fertiliser survey (in Norwegian only) shows that a total of 15 200 tonnes of phosphorous in the form of inorganic fertiliser and manure was applied to agricultural areas in Norway in 2013. Thus, in a “resource perspective in an ideal world” the wastewater sector could potentially cover around 9 per cent of the phosphorous demand in the agricultural sector.
In 2015, the phosphorous treatment efficiency of the wastewater sector as a whole has been estimated at 69 per cent of the incoming amount. However, there is a big regional variety, and treatment efficiencies are generally higher in counties on the eastern part of the country and in the Trøndelag area, where treatment permits are stricter and recipient capacity is somewhat lower (more sensitive to pollution).
4.5 per cent increase in costs of wastewater services
In 2015, the total cost for all municipalities was NOK 7 billion. This constitutes an increase of 4.5 per cent compared to 2014. The costs related to the wastewater sector are made up of capital costs and operating costs, and the increase mentioned is due to an increase in both operating and capital costs.
Wastewater fees are determined by the municipalities in accordance with the full cost principle. Local conditions such as patterns of built-up areas, topography, bedrocks in the ground, the need for pumping stations and treatment requirements are all factors behind the variation in fees.
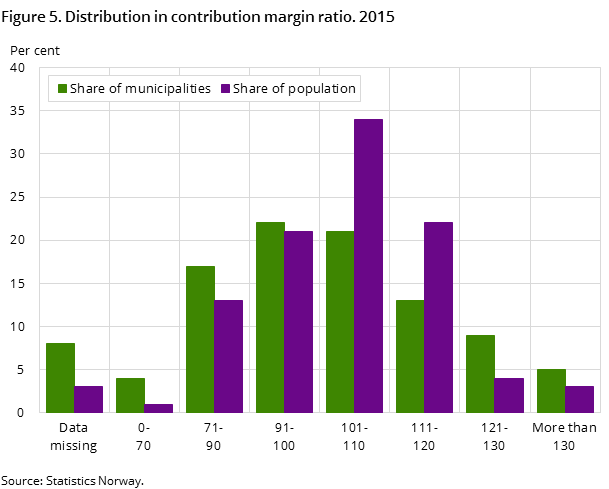
Around half the population live in municipalities with a contribution margin ratio of more than 100 per cent, which means that the incomes from fees are higher than the fee calculation basis. At the same time, a total of 85 per cent of the municipalities have a full cost ratio between 91 and 110 per cent, and these municipalities are home to 95 per cent of the population. Thus, a major part of the population lives in municipalities where the costs for wastewater services are covered by fees. The municipality may then use the surplus to fund provisions or cover earlier deficits.
Reason for re-calculation of small wastewater facilitiesOpen and readClose
The statistics of small wastewater facilities (less than 50 pe) are based on a full count reporting from the municipalities. But because not all municipalities have a complete overview of the situation, or they have reported wrong or incomplete, the basic data is therefore evolving over time. Statistics Norway has for that reason looked at all the reportings of small wastewater facilities back to 2002, and corrected obvious errors or missing data in order to create more consistent time series in the statistics.
Contact
-
Gisle Berge
E-mail: gisle.berge@ssb.no
tel.: (+47) 48 12 19 97
