Content
Published:
This is an archived release.
Sharp increase in greenhouse gas emissions in 2003
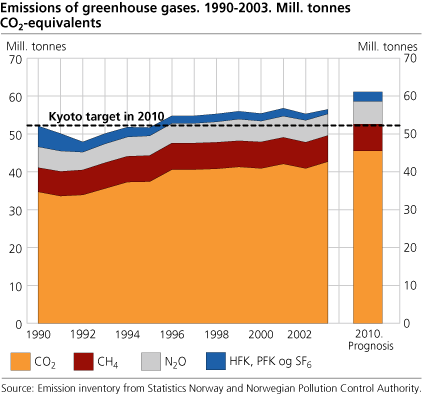
In 2003, greenhouse gas emissions in Norway increased by 2 per cent or 1.1 million tonnes, after a passing decline in 2002, due to lower industrial activity. The increase equals approximately the estimated emissions from one of the planned gas power plants at Kårstø and Kollsnes. Emissions of CO2 increased by 1.8 million tonnes, while there was a small decrease in emissions of the other greenhouse gases.
The total Norwegian emissions of greenhouse gases were 56.5 million tonnes. According to the Kyoto protocol, Norwegian greenhouse gas emissions in 2008-2012 should not be more than 1 per cent higher than in 1990. From 1990 to 2003, however, emissions have increased by 8 per cent.
This is shown in new figures from Statistics Norway and the Norwegian Pollution Control Authority.
High electricity prices caused emission increase
Parts of the manufacturing industries, households etc. can, for some purposes, choose between use of electricity and oil, i.a. depending on price conditions. During the winter 2003 electricity prices were unusually high, which led to a considerable increase in use of oil, which in turn led to an increase in emissions of greenhouse gases. The total amount of energy used in 2003 was about the same as in 2002, but use of electricity decreased by 4.5 per cent, while consumption of petroleum products rose by almost 5 per cent. Because of lower electricity prices this winter, a changeover to more use of oil products for 2004 is not expected.
Other emissions are also increasing
Oil and gas production contributed to a considerable increase in greenhouse gas emissions in 2003. The majority of the CO2 emissions came from combustion of natural gas for electricity production on the continental shelf. Production of oil was reduced by 11 per cent but the emissions were higher because of increased production of natural gas. Emissions from oil refineries, gas terminals and petrochemical industry increased due to a higher activity level.
Emissions from road traffic continued to increase in 2003, due to more use of diesel cars. Emissions from domestic shipping also increased.
Decreased emissions from processing industry
Greenhouse gas emissions from production of aluminum decreased in 2003 despite increased production. Technology improvements and better process control have led to decreased emissions of perfluorocarbons (PFCs). Production of fertilizers has increased without corresponding increase in emissions, due to process improvements.
Of the total greenhouse gas emissions in 2003, reckoned in CO2 equivalents, 76 per cent came from CO2, 12 per cent from methane, 10 per cent from nitrous oxide and 2 per cent from HFCs, PFCs and SF6. CO2 accounts for almost all of last year's increase in total emissions. The increase was 4 per cent or 1.8 million tonnes.
Reduced emissions of other greenhouse gases
Emissions of methane were at the same level in 2003 as the year before. The most important sources of methane emissions are landfills and agriculture. Emissions of nitrous oxide were reduced by 2 per cent. The most important sources of nitrous oxide emissions are agriculture, manufacture of commercial fertilizer and road traffic. Emissions from road traffic and agriculture increased whereas emissions from manufacture of commercial fertilizer decreased due to technological improvements.
The emissions of SF6 increased by 10 per cent in 2003 after a reduction by two thirds in 2002 because of closing down of the production of magnesium. As mentioned earlier, emissions of perfluorocarbons (PFCs) were reduced due to technology improvements and better process control. Emissions of hydrofluorocarbons (HFCs) decreased for the first time. HFCs replace gases that are harmful to the ozone layer.
Source distribution
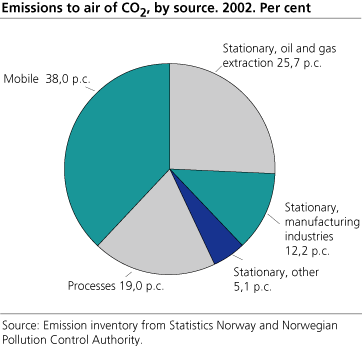
The source distribution of the emissions in 2003 is too uncertain to be presented. In 2002, however, 43 per cent of the CO2 emissions came from stationary combustion, nearly half of this from combustion of natural gas for electricity production on the continental shelf; 23 per cent came from road traffic and 16 per cent from processes in the manufacturing industries. The remaining 18 per cent are mostly due to other processes and air and sea traffic.
A detailed description of 2003 emissions will be published in January or February 2005. More information about emissions 1990-2002 is found here. (lenke til artikkel 13/2-04)
Emissions from nitrogen oxides, NMVOC and ammonia are treated in a separate article. (lenke til artikkel 1/4-04). In February, new figures on Norwegian emissions of persistent organic pollutants and heavy metals were presented. Read the article .
Read more:
State of the Environment Norway
Other articles on emission to air :
Up and down since 1996 (SSB 13.02.2004).
Sulphur emissions reduced since 1990 (SSB 13.02.2004)
Emission of heavy metals down (SSB 13.02.2004)
Tables in the StatBank .
Tables:
This page has been discontinued, see Emissions to air, Annually.
Contact
-
Trude Melby Bothner
E-mail: trude.melby.bothner@ssb.no
tel.: (+47) 40 81 14 25
-
Berit Storbråten
E-mail: berit.storbraten@ssb.no
tel.: (+47) 40 81 14 23


