Content
Published:
This is an archived release.
Lower greenhouse gas emissions in 2011
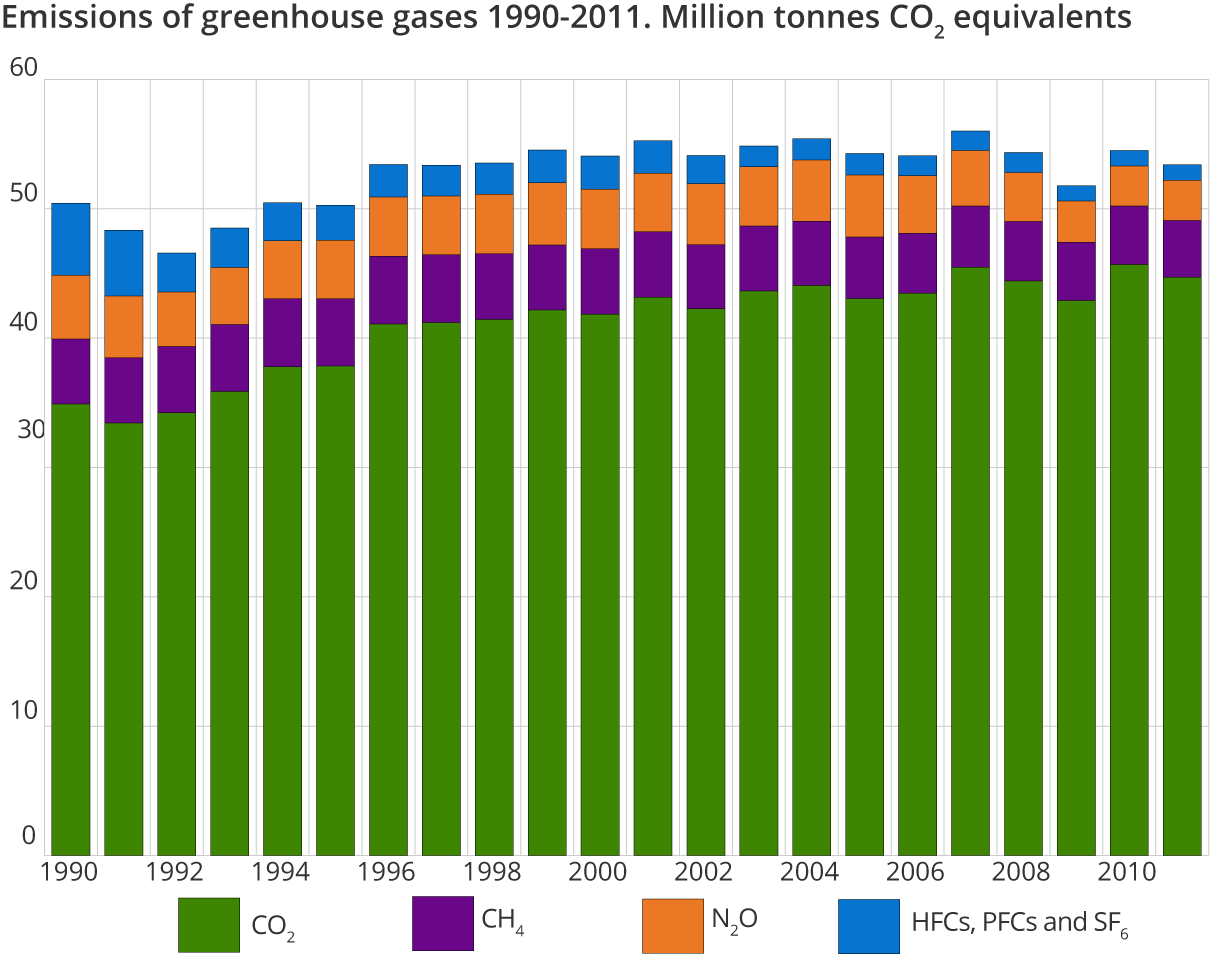
In 2011, domestic Norwegian greenhouse gas emissions amounted to 53.4 million tonnes of CO 2 equivalents. This is 2.1 per cent less than in 2010. Lower heating emissions caused the largest reduction, but also manufacturing, oil and gas activities and energy production contributed.
| 2011 | Change in per cent | ||
|---|---|---|---|
| Since 1990 | 2010 - 2011 | ||
| 1Figure for the previous year. Source: The Norwegian Forest and Landscape Institute. | |||
| Emissions from Norwegian territory | 53.4 | 5.8 | -2.1 |
| Oil and gas extraction | 13.6 | 75.9 | -1.8 |
| Manufacturing industries and mining | 11.8 | -38.7 | -2.4 |
| Energy supply | 2.1 | 549.8 | -10.2 |
| Heating in other industries and households | 1.6 | -40.0 | -18.2 |
| Road traffic | 10.1 | 29.5 | -0.4 |
| Aviation, navigation, fishing, motor equip. etc. | 7.3 | 29.4 | 0.0 |
| Agriculture | 4.5 | -10.1 | 0.7 |
| Other | 2.5 | 13.6 | 0.9 |
| Sinks and emissions from forest and land areas in Norway1 | -32.9 | 279.7 | .. |
| Emissions from international air and ocean transport | 12.4 | -13.0 | -14.6 |
| International air transport | 1.8 | 191.4 | 20.6 |
| International ocean transport | 10.6 | -22.2 | -18.6 |
This is shown in revised figures on greenhouse gas emissions from 1990 to 2011. The new figures confirm the trend in the preliminary figures published in May 2012, but the emission level is somewhat higher in the new figures. This is due to higher emissions from agriculture because of a change in the basis for the calculation of enteric fermentation emissions from young cattle, which has caused a significant rise in emissions of methane from these animals for the whole period 1990-2011.
The domestic Norwegian greenhouse gas emissions were 5.8 per cent higher in 2011 than in 1990. Nevertheless, the greenhouse gas emissions in 2011 were the lowest since 1995, with an exception for 2009, when reduced economic activity caused considerably lower emissions compared with the preceding and following years.
CO 2 dominates
Emissions of CO 2 rose by almost 28 per cent in the period 1990-2011, whereas emissions of methane, nitrous oxide and fluorinated gases decreased. The CO 2 share of total greenhouse gas emissions increased from 69 per cent in 1990 to 84 per cent in 2011. Oil and gas activities constituted 29 per cent of the CO 2 emissions in 2011, and were also responsible for 57 per cent of the increase in CO 2 emissions in the period from 1990. Twenty-five per cent of the CO 2 emissions in 2011 came from manufacturing industries – this is a decrease from 33 per cent in 1990.
Less methane
The most important sources for emissions of methane are agriculture, waste disposals and oil and gas activities. In 2011, these were responsible for 53, 24 and 14 per cent of the total respectively. The emissions decreased by 2.8 per cent from 2010, mainly because of reductions in oil and gas activities and agriculture. Although the emissions of methane from oil and gas activities have been almost doubled in the period 1990-2011, reductions in emissions from agriculture and waste disposals have resulted in a 13 per cent drop in total methane emissions from 1990 to 2011. Emissions from waste disposals were reduced by 38 per cent from 1990, particularly because of utilisation of landfill gas for energy production, but partly also due to the fact that disposing of waste at landfills has been prohibited since July 2009, although some dispensations have been granted in a transitional period. Emissions from agriculture were 11 per cent lower in 2011 than in 1990.
...and nitrous oxide
Nitrous oxide emissions decreased by 37 per cent from 1990 to 2011, although there was a minor increase from 2010 to 2011. Agriculture is the dominating source of these emissions, and was responsible for 70 per cent of the total in 2011. Previously, large emissions originated from manufacturing industries, but improved technology has led to significant reductions in emissions in recent years.
....and fluorinated gases
The emissions of fluorinated gases have been reduced by 78 per cent from 1990 to 2011. These emissions made up 2 per cent of the total greenhouse gas emissions in 2011; a fall from 11 per cent in 1990. Notwithstanding, emissions increased by 3.5 per cent from 2010 to 2011 due to higher emissions of HFCs and PFCs. The closure of the production of magnesium, which caused large emissions of SF6, played a large role in this decline. This was also the case for the reduction in PFCs from the production of aluminium, due to improvements in technology.
Considerable net sinks in forest
Since the 1920s, the cutting of Norwegian forests has been lower than the growth. This implies that Norwayhas larger sinks than emissions of CO 2 in forest. According to calculations by the Norwegian Forest and Landscape Institute, net sinks of greenhouse gases from forest and areas in Norway amounted to approximately 33 million tonnes of CO 2 in 2010. This is about 60 per cent of the annual greenhouse gas emissions in CO 2 equivalents in recent years.
Change in proportions between emission sources
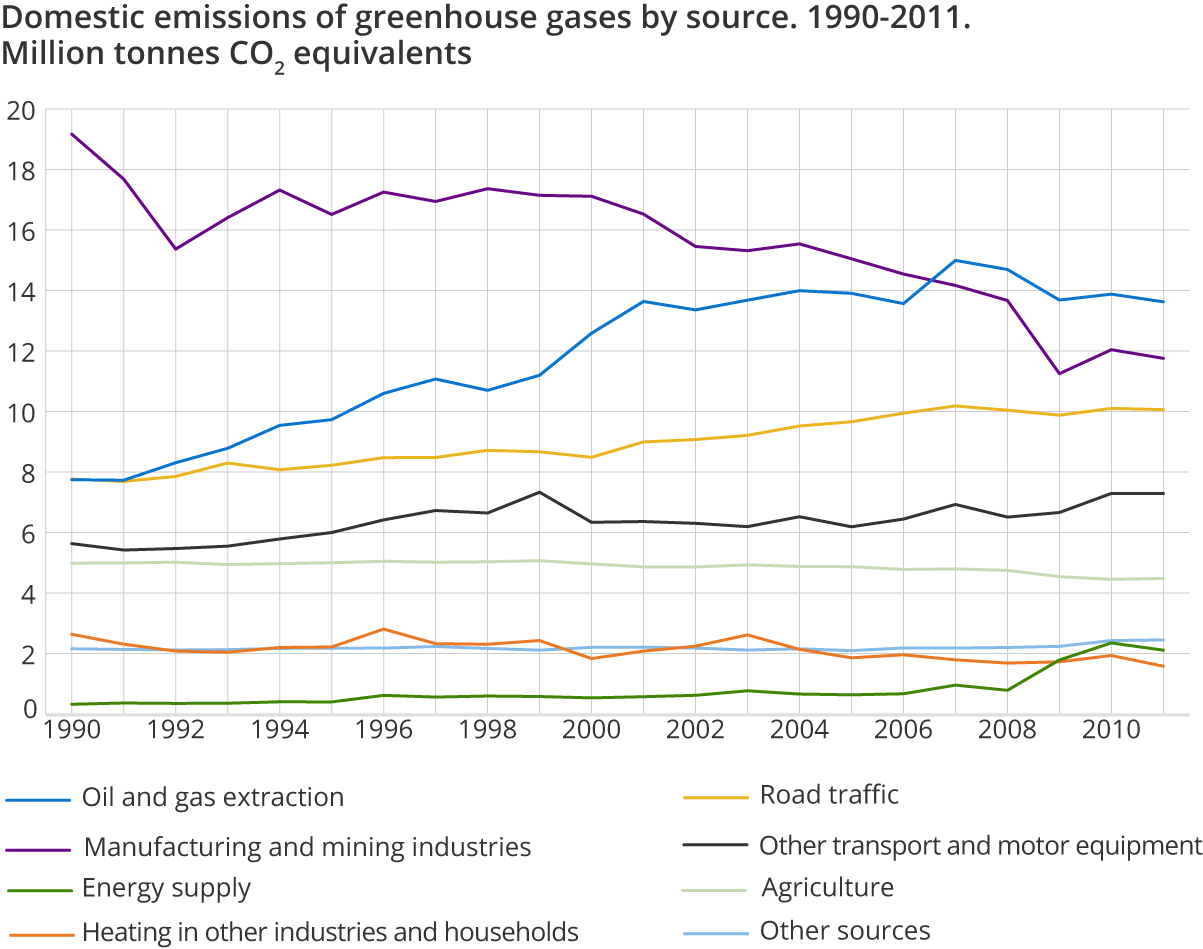
In both 1990 and 2011, emissions from oil and gas activities, manufacturing industries and road traffic constituted approximately two thirds of the greenhouse gas emissions. The ratio between these sources has, however, changed strongly during the period. In 1990, emissions from manufacturing industries were larger than oil and gas activities and road traffic together, but from 2007, the oil and gas activity alone has been the most important source.
Oil and gas activities were responsible for 26 per cent of the greenhouse gas emissions in 2011, compared to 15 per cent in 1990. These emissions have, nevertheless, decreased somewhat in recent years, after reaching a peak in 2007. From 2007, the LNG plant at Melkøya has contributed to a rise in emissions from oil and gas activities. There were particularly large emissions from flaring in 2007 and 2008, i.e. burning off the gas without utilising the energy. At the same time, emissions from activities on the continental shelf have declined. This is linked to a strong reduction in the production of raw oil in recent years, after a peak in 2000. Even though the production of natural gas has been more than doubled in the same period, the total Norwegian production of oil and gas in 2011 was the lowest since 1995.
Emissions from manufacturing industries were almost 40 per cent lower in 2011 than in 1990, and while these emissions constituted 38 per cent of the total in 1990, the share was reduced to 22 per cent in 2011. The decrease can be explained by plant closures, less use of oil products and improved technology.
Road traffic was responsible for 19 per cent of the greenhouse gas emissions in 2011, compared to 15 per cent in 1990. The actual emissions increased by 29 per cent. There has been a pronounced shift between emissions from petrol and diesel cars; the share of greenhouse gas emissions from diesel cars increased from 29 per cent in 1990 to 69 per cent in 2011.
Emissions from agriculture have not changed much during the period, but have declined somewhat in recent years. In 2011, 8 per cent of the greenhouse gas emissions originated from agriculture (methane and nitrous oxide). The calculation basis for enteric fermentation from young cattle has been altered, and has resulted in considerably higher emissions of methane from these animals than in previous calculations. This has, together with smaller changes for some other animals, resulted in annual emissions of methanefrom enteric fermentation in the period 1990-2011 that are 8 400–18 100 tonnes higher than in previously published emission figures.
Preliminary emission figures for 2012 will be published in May 2013.
International obligations and national targets on emission cutsOpen and readClose
Norway’s allocated emission quota from the UN amounts to 50.1 million tonnes of CO2 equivalents annually in the period 2008-2012. This is 1 per cent more than the domestic emissions in 1990. The emissions in 2008-2010 exceed the allocated annual amount.Norway can, however, fulfil the obligation by using three flexibility mechanisms: Joint Implementation, the Clean Development Mechanism and quota trading.
The emission inventory that is reported annually to the UN also includes emissions and sinks in forest and other land areas. According to the KyotoProtocol,Norwayhas an annual entitlement to be credited approximately 1.5 million tonnes from sinks in forests for the years 2008-2012.Norway’s policy, however, is that these sinks shall not be used to fulfil the Kyoto Protocol obligations.
In 2008, the majority in the Norwegian parliament entered into an agreement on a national target for emission reductions. The target is that domestic emissions shall not exceed 45-47 million tonnes of CO2 equivalents in 2020. This target was confirmed in a Report to the Storting in2012. In 2011, the emissions were 6-8 million tonnes above this national target.
About the emission inventoryOpen and readClose
Statistics on emissions to air are now available with detailed sub-divisions by industry and source, and include figures for 2011. The statistics broken down by industry are used in the reporting of environmental accounts to Eurostat (the statistical office of the European Union). The statistics broken down by source are used as a basis for reporting on greenhouse gases, long-range transboundary air pollution, hazardous substances and heavy metals.
The emission inventory is prepared and published by Statistics Norway, with contributions from the Climate and Pollution Agency (Klif). StatisticsNorwayis responsible for compiling the statistics and for supplying most of the activity data. Klif contributes in particular to the development of methodology, emission factors and emission data from major point sources.
Read more about documentation of the emission inventory, (an updated version will be published in July 2013).
Contact
-
Trude Melby Bothner
E-mail: trude.melby.bothner@ssb.no
tel.: (+47) 40 81 14 25
-
Berit Storbråten
E-mail: berit.storbraten@ssb.no
tel.: (+47) 40 81 14 23


