Content
Published:
This is an archived release.
Minor reduction in greenhouse gas emissions in 2013
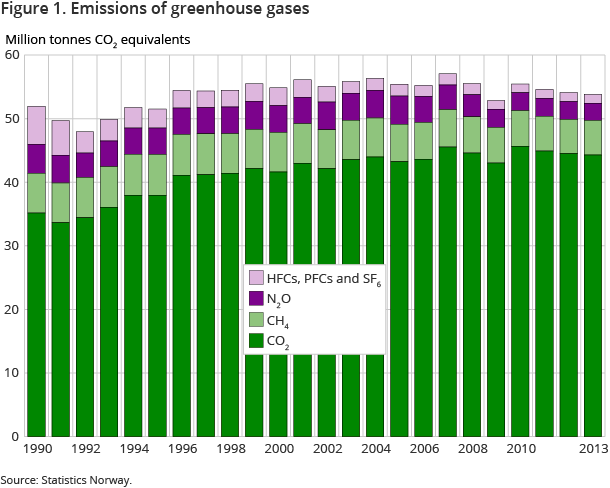
The Norwegian domestic greenhouse gas emissions totalled 53.9 million tonnes of CO2 equivalents in 2013. This represents a decrease of 0.2 million tonnes of CO2 equivalents, or 0.3 per cent compared to 2012.
| 2013 | Change in per cent | ||
|---|---|---|---|
| Since 1990 | 2012 - 2013 | ||
| 1Figure for the previous year. The change in per cent shows increase in net uptake in forests since 1990. Source: The Norwegian Forest and Landscape Institute. | |||
| Emissions from Norwegian territory | 53.9 | 3.7 | -0.3 |
| Oil and gas extraction | 13.8 | 79.1 | 0.0 |
| Manufacturing industries and mining | 12.1 | -38.1 | 1.0 |
| Energy supply | 1.8 | 324.5 | 0.7 |
| Heating in other industries and households | 1.5 | -45.8 | -6.8 |
| Road traffic | 10.1 | 30.1 | 0.2 |
| Aviation, navigation, fishing, motor equip. etc. | 7.0 | 26.0 | -3.0 |
| Agriculture | 4.7 | -14.4 | 0.2 |
| Other | 2.9 | 7.2 | -0.6 |
| Sinks and emissions from forest and land areas in Norway1 | -26.7 | 163.0 | .. |
| Emissions from international air and ocean transport | 11.5 | -19.4 | 6.7 |
| International air transport - Norwegian airlines | 2.7 | 332.6 | 28.2 |
| International ocean transport - Norwegian operated ships | 8.8 | -35.3 | 1.6 |


This figure is taken from the latest revision of the figures on greenhouse gas emissions for the years 1990-2013. The emissions are slightly larger than indicated in the previous calculations as a result of new guidelines on calculating greenhouse gas emissions in the latest revision of the figures (see information box at the end of the page). The emissions in 2013 were 3.7 per cent larger than in 1990. The relative increase compared to 1990 was slightly less after the new guidelines were implemented in the latest version of the calculations.
Emissions from coastal navigation and heating reduced
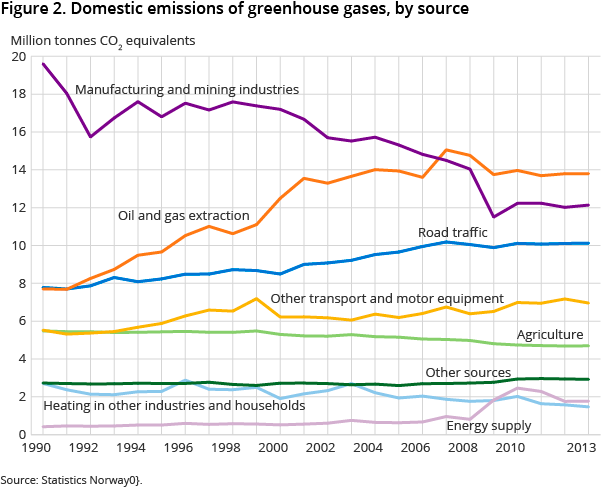
A reduction in the emissions from coastal navigation and heating in households and industry made the largest contribution to the decrease in the total emissions from 2012 to 2013. Heating of households and industry had a decrease in emissions of 0.1 million tonnes of CO2 equivalents, or 6.8 per cent compared to 2012. The reduction in this year’s emissions from heating is related to a decrease in consumption of fuel oil.
The emission figure for coastal navigation is 0.36 million tonnes of CO2 equivalents lower compared to 2012. This decline in the emissions is related to the reduction in sales of energy for coastal navigation purposes from 2012 to 2013.
CO2 more dominant in the domestic emissions
Emissions of CO2 have increased by 26.1 per cent over the period 1990 to 2013, and represent 82.3 per cent of the total domestic emissions in 2013 versus 67.8 per cent in 1990. Emissions of CO2 thereby represent a larger part of the total emissions in 2013 compared to 1990. The latest calculations show a small reduction (0.3 per cent) in emissions of CO2 from 2012 to 2013.
Methane gas emissions have decreased by 13.4 per cent over the period 1990-2013, but showed a weak incline in 2013. Methane gas emissions represent 10.1 per cent of the total greenhouse gas emissions in 2013, which is 2.7 percentage points less than 1990.
Emissions of N2O and other greenhouse gases (PFC, HFC, SF6) have been reduced by 40.1 per cent and 76.7 per cent respectively since 1990. These emissions represent 7.6 per cent of the total greenhouse gas emissions in 2013. Emissions of N2O, PFCs and SF6 show a continued decline in 2013, while increased use of fluorinated products has led to more HFC gases being emitted in 2013 compared to 2012.
Oil and gas extraction still contributes most to the emissions
Emissions from oil and gas extraction are unchanged from 2012 to 2013 and since 2007 have contributed the most to the domestic greenhouse gas emissions. Mining and manufacturing industry is the second largest contributor and represents an increase in emissions of 0.12 million tonnes CO2 equivalents since 2012, which corresponds to a growth of about 1 per cent.
Road traffic contributed with about 19 per cent of the total greenhouse gas emissions in 2013, and shows only minor changes compared to 2012.
Emissions from enteric fermentation and manure in agriculture and landfills combined make up about 8.6 per cent of the total emissions in 2013 according to the latest figures. This is a larger portion of the total emissions compared with earlier figures. The reason for this is that the emissions in these categories mainly consist of methane gas, which has a larger GWP in the latest calculations (see section below).
New emission sources and conversion factors this year
As a consequence of the new guidelines on calculations of greenhouse gas emissions, a number of new emission sources are included in the latest calculations (see information box at the end of the page). However, the sum of these new emission sources has a minor effect on the calculated greenhouse gas emissions in total.
An upwards adjustment of the GWP for methane and downwards adjustment of the GWP of N2O has in combination led to the total greenhouse gas emissions in 2013 being calculated to about 0.76 million tonnes of CO2 equivalents higher compared to using the old GWP values. This explains a large portion of the inflated values in the latest calculations compared to earlier figures. The new GWP values are used in the calculations for the entire time series 1990-2013.
New guidelines on calculation of greenhouse gas emissionsOpen and readClose
The UN organisation IPCC has introduced new guidelines on the calculation of greenhouse gas emissions. These new guidelines are effective from 2015 on the entire time series 1990-2013.
The changes entail the inclusion of new emission sources in the calculations in addition to changes to emission factors and conversion factors (GWP) for most greenhouse gases.
Norwegian commitments and goals for reductions in greenhouse gas emissionsOpen and readClose
In the second period of the Kyoto agreement (2013-2020), Norway is committed to reducing its emissions of greenhouse gases to 84 per cent of the domestic emission in 1990. Norway may fulfil its obligations partly by three market-based mechanisms; International Emissions Trading, Clean Development Mechanism, Joint Implementation.
In 2008, the majority in the Norwegian parliament entered into an agreement on a national target for emission reductions. The target is to reduce the global greenhouse gas emissions by 30 per cent of domestic emissions in 1990. About two thirds of this reduction will be domestic cuts, setting the goal for total greenhouse gas emissions to 45-47 million tonnes of CO2 equivalents in 2020.
Contact
-
Trude Melby Bothner
E-mail: trude.melby.bothner@ssb.no
tel.: (+47) 40 81 14 25
-
Berit Storbråten
E-mail: berit.storbraten@ssb.no
tel.: (+47) 40 81 14 23
