Content
Published:
This is an archived release.
Air emissions increase but less than value added
The economic growth for most sectors in Norway was larger than the growth in greenhouse gas emissions in the period 1990 to 2001. The transportation sector pollutes the most per value added.
The decoupling of environmental consequences from economic growth continues to be a central theme in a variety of environmental fora. The situation in Norway is presented with new data from the environmental and economic accounts.
Higher economic growth than growth in air emissions
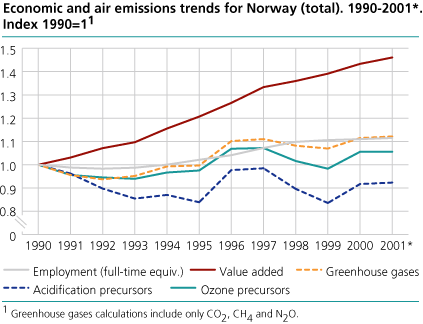
From 1990 to 2001, the economic growth for Norway, measured in value added, was higher than the growth in emissions of greenhouse gases and tropospheric ozone precursors, and was higher than the growth in employment. Emissions of acidification precursors decreased during the same period. The different industries' contributions to changes in value added and air emissions vary considerably, which is illustrated in the following examples.
Transportation industries most polluting
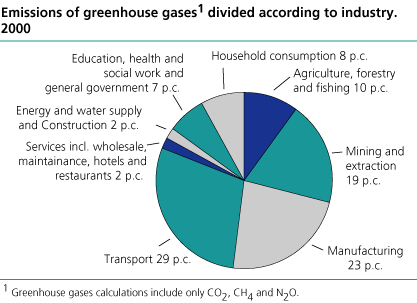
In 2000 the transportation industries emitted 29 per cent of Norway's total greenhouse gas emissions and was therefore the sector that contributed the most to the country's total greenhouse gas emissions. Ocean transport is included here in the transportation industries, in contrast to the national greenhouse gas emissions that covers activities in Norway. Ocean transport alone contributed 20 per cent of Norway's total greenhouse gas emissions in 2000. Industry and Mining and quarrying (including oil and gas extraction) are also important sources of greenhouse gas emissions, with respectively 23 and 19 per cent of emissions.
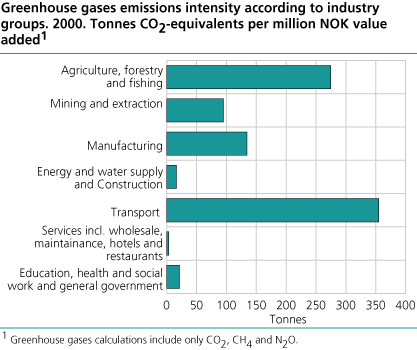
The relationship of specific emissions from an industry to its respective value added is called emissions intensity. Transport had the highest greenhouse gas emissions intensity, while agriculture, forestry and fishing were second and manufacturing was third. Oil and gas extraction had a somewhat lower emissions intensity due to very high levels of value added.
Reduction in pollution per NOK
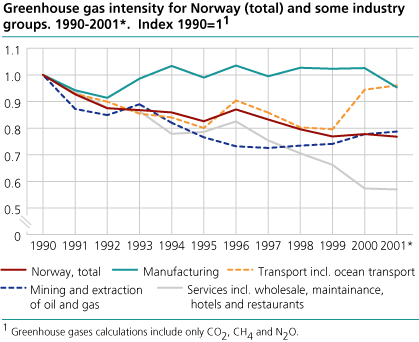
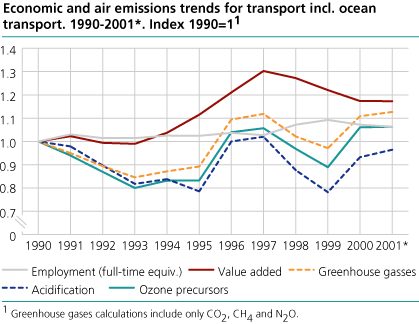
The pollution intensity (calculated as emissions units in tonnes/kg/g per NOK value added in constant prices) for Norway as a whole, has gone down for all three aggregated emissions types, greenhouse gases, acidification precursors and tropospheric ozone precursors during the period 1990-2001. The figure shows the developments in greenhouse gas intensities for Norway as a whole and for specific industries in the same period. The services industries show a decreasing trend for greenhouse gas intensity during the period. The manufacturing industries relationship between greenhouse gas emissions and value added remains fairly constant. For the transportation industries the picture is more varied. The large increase from 1999 to 2000 is due primarily to higher activity in ocean transport, of which there is little within Norwegian waters.
Manufacturing: Value added and emissions have similar development
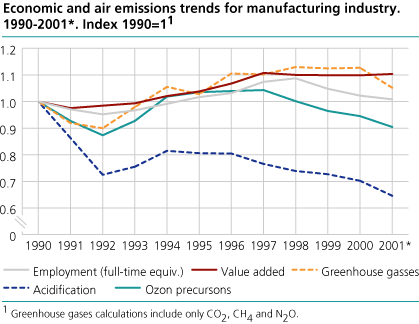
In the manufacturing industries, air emissions and value added have varied during the period 1990-2001. Certain groups within the manufacturing industries have been exempt from one of the mechanisms that has been meant to reduce greenhouse gas emissions; i.e., there is no CO2-tax on the use of fossil fuels used in industrial processes. Norwegian authorities have focused strongly on reducing emissions of acidification precursors from industries and the results can be readily seen in the figure.
In the later portion of the time period, value added has stabilized and employment has gone down. This is because certain types of industries are currently in a depression and have reduced production. In particular there has been a decrease in production in the metals industry (ferro-alloys). The reduction in production has resulted in a nearly 7 per cent decrease in greenhouse gas emissions in 2001 when compared with the year before.
Large economic and emissions growth in the Oil industry
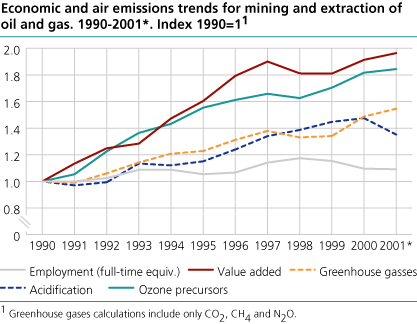
Mining and Quarrying, which includes extraction of crude petroleum and natural gas, was responsible for 13 per cent of Norway's total value added in 2000. During the period 1990-2001, value added increased 96 per cent. There has been a long-term focus on reducing this industry's air emissions and these measures have yielded results. Emissions of greenhouse gases and acidification precursors have increased but at a lower rate than the increase in value added. The industry is responsible for 30 per cent of emissions that lead to tropospheric ozone. Measures taken to reduce these types of emissions have just recently started to give positive results.
Uncertain trends for transportation sector
The transportation sector is responsible for the largest portion of air emissions, when looked at in total and when taken in relationship to value added. This is the case for greenhouse gases, acidification precursors and for tropospheric ozone precursors, where this sector contributes, respectively 29, 62 and 42 per cent of total emissions in 2000.
Emissions calculations for ocean transport are very uncertain. The combined emissions profile for Norway is strongly influenced by ocean transport that alone was responsible for 20 per cent of the country's greenhouse gas emissions in 2000. It is primarily ocean transport that contributes to the large variations in air emissions in this sector during the period 1990-2001 (see figure). The variations in value added are primarily accounted for in transport via pipelines of oil and natural gas.
Reduced emissions from the Services industry
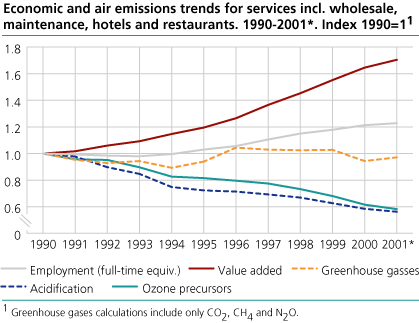
The developments in the services industry have influenced the pollution intensity for Norway in a positive direction during the period 1990-2001. On average the services industry is not pollution intensive, while at the same time contributes with a consistently growing portion of the country's GDP. During the period 1990-2001, the services industry's portion of total value added increased from 34 to 40 per cent.
Greenhouse gas emissions from the services industry were fairly constant during the time period, while acidification emissions and emissions that lead to tropospheric ozone went down.
Strong increase in household solid waste amounts
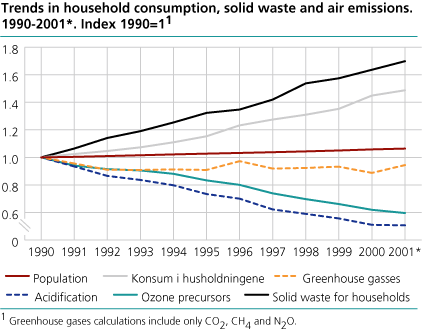
In addition to air emissions, statistics are also available for solid waste for households. The most relevant indicator of economic development for households is consumption.
From 1990 to 2001 the development of household consumption and air emissions have gone in different directions. Emissions of acidification precursors and emissions that lead to tropospheric ozone show downward sloping trends, while the trend for greenhouse gas emissions is more stable, in spite of higher levels of consumption. On the other hand, production of household waste has had a totally different development during this period. Household waste amounts have actually increased at a higher rate than consumption.
Environmental Accounts: Different definitions
There are major differences between the Norwegian NAMEA (National Account Matrix including Environmental Accounts) emissions data and the national air emissions data that are published by Statistics Norway and the Norwegian Pollution Control Authorities (SFT). The NAMEA-data uses an economic definition of Norway, which is the same that is used for the national accounts, whereas the national air emissions data use a geographic-based definition (i.e. activities inside Norway). The major differences between these data sets are the inclusion of air emissions from ocean transport and foreign air transportation activities in the NAMEA-data.
Additional data from the Norwegian Environmental Accounts is available at StatBank .
Tables:
Additional information
Contact
-
Ingrid Semb Weyer
E-mail: ingrid.semb.weyer@ssb.no
tel.: (+47) 40 90 23 51
-
Trine Heill Braathu Randen
E-mail: trine.heill.braathu.randen@ssb.no
tel.: (+47) 91 10 67 45

