Content
Published:
This is an archived release.
Higher economic growth than increase in air emissions
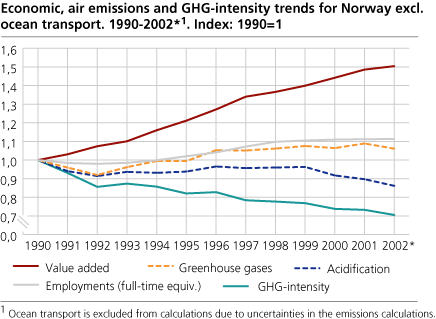
Economic growth for the period 1990-2002 was higher than the increase in greenhouse gas emissions and other air emissions. This trend has been stronger since 1996 than in preceding years. Service industries were the industries showing the largest economic growth relative to the growth in greenhouse gas emissions.
This is shown by a new merging of data from the national accounts and environmental statistics. Compared with statistics on emissions to air, the focus of this satellite account is to look into the combined development of economic activity and the influence on the environment. Norway is aiming at continued economic growth along with reduced emissions.
Most industries increased their emissions efficiency
We say that an industry is more emission efficient if the emission intensity (measured by quantity of emissions pre NOK value added) decreases. In the graphs this is illustrated by the Greenhouse gas emission intensity (GHG-intensity).
Increased growth in the least emission intensive industries (service industries etc) is the main reason why the economy grew faster then emissions for Norwegian economic activity. The fact that emissions from oil and gas extraction activities are reduced while value added from these activities has increased also contributed to this trend. The same relationship is seen for the manufacturing industries, but these industries had a slight decrease in value added in the period 1997-2002.
From 1990 to 2002, the economic growth for Norway, as measured by value added at constant prices, was higher than the growth in emissions of greenhouse gases and tropospheric ozone precursors, and was higher than the growth in employment as well. Emissions of acidification precursors and tropospheric ozone precursors decreased during the same period. Emissions of greenhouse gases have increased, but not as much as gross value added, though the growth rates of value added have decreased in the last part of the period. The different industries' contributions to changes in value added and air emissions vary considerably.
Transportation industries most polluting
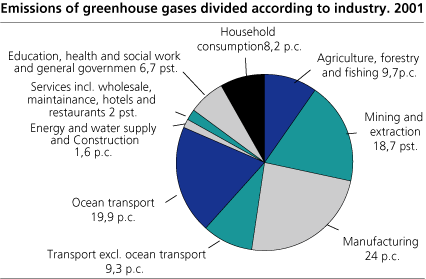
Unsurprisingly, transportation industries have high emissions intensities relative to other industries. Compilations show, that in 2001 (the last year when final figures are available) the transportation industries emitted 29 per cent of Norway's total greenhouse gas emissions and was the main contributor to the country's total greenhouse gas emissions. However, this includes Ocean transport, and our assessments show that this industry alone emitted almost 20 per cent of Norway's total greenhouse gas emissions in 2001. The compilations of gas emissions from Ocean transport are, however, particularly uncertain.
Industry and Mining and quarrying (including oil and gas extraction) are also important sources of greenhouse gas emissions, with respectively 24 and 19 per cent of emissions.
Economic growth in the Oil industry entailed reduced emissions intensity
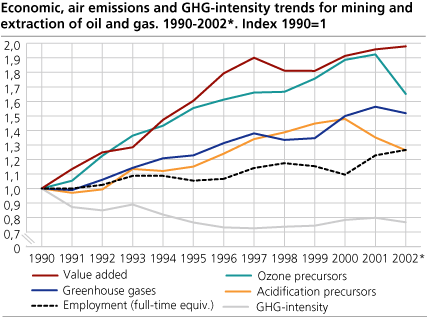
There has been a long-term focus on reducing air emissions from Mining and Quarrying, which includes extraction of crude petroleum and natural gas. These industries were responsible for 18.6 per cent of Norway's total emissions of greenhouse gases, and 13.4 per cent of total value added (at constant 1995-prices) in 2001. The measures taken to reduce air emissions from the industry are now yielding results. Emissions of greenhouse gases, acidification precursors as well as tropospheric ozone precursors decreased from 2001 to 2002.
Volatile organic compounds (NMVOCs) had the largest reduction in emissions from 2001 to 2002. The oil industry has focused on increasing the efficiency of turbines with respect to CO2 emissions, adapting to a tax on CO2 emissions. An unfavorable side effect of this is an increase in the NOx emissions from the turbines. However, less flaring and better use of diesel oil counteracted the increased NOx emissions from turbines, so that in sum NOx emissions decreased. This is shown in the diagram as a decrease in emissions of acidification precursors.
In this period, value added increased. The growth in value added, together with decreased emissions of greenhouse gases, produced lower greenhouse gas intensity for the industry. In consequence, greenhouse gas intensity in oil activities decreased from 2001 to 2002 for the first time since 1996.
Manufacturing: Closing down establishments contributed to less pollution
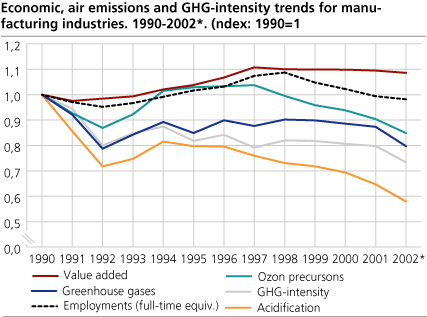
In the manufacturing industries, air emissions and value added have varied during the period 1990-2002. For the last part of the period the growth of value added has leveled, and employment has decreased. This is due to a recession with reduced activity level for some types of manufacturing.
Greenhouse gas intensity was relatively constant from 1992 until 2001. From 2001 to 2002 there was a reduction. Apparently reduced emissions from manufacturing industries would indicate increased environmental efficiency. However, the explanation is rather that several enterprises in manufacturing industries that used to have large emissions to air were closed down. Volume growth rates of value added for total manufacturing industry have been slightly negative from 1997, but the decrease was larger for emissions of greenhouse gases, acidification precursors and tropospheric ozone precursors.
Reduced emission intensity for Services industries
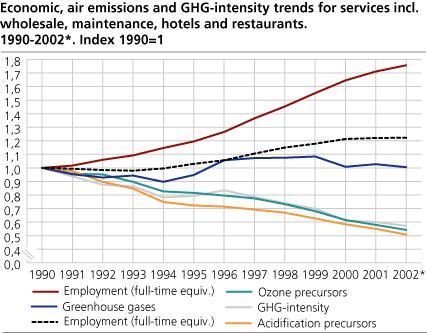
Most services industries are not pollution intensive, while at the same time contributing to a consistently growing portion of the country's GDP. During the period 1990-2002, the services industry's portion of total value added increased from 34 to 41 per cent.
Greenhouse gas emissions from the services industry were fairly constant during the time period, while acidification emissions and emissions that lead to tropospheric ozone decreased. Contributing to this improvement is a reduction in the sulphur contents of auto diesel as well as the replacement of older automobiles used in the industries by more emission efficient automobiles.
Strong increase in household solid waste amounts
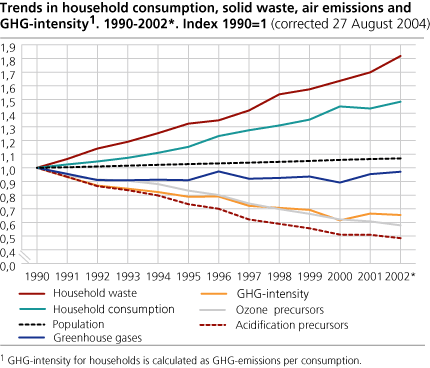
In addition to air emissions, time series statistics are also available for population and household's solid waste disposal. The most relevant indicator of economic development for households is household consumption expenditure.
From 1990 to 2002 the development of household consumption and air emissions have gone in different directions. Emissions of acidification precursors and emissions that lead to tropospheric ozone show downward sloping trends. This is mainly explained by the change for more emission efficient cars. The trend for greenhouse gas emissions is more stable, in spite of higher levels of consumption.
On the other hand, production of household waste has had a totally different development during this period. Household waste amounts continues to increase at a higher rate than consumption for the whole period.
Environmental Accounts: Different definitions
This article is based on environmental satellite accounts of the NAMEA type (NAMEA: National Account Matrix including Environmental Accounts, for further information consult 'About the statistics'). There are essential differences between the Norwegian NAMEA emissions data and the national data on air emissions that are published by Statistics Norway and the Norwegian Pollution Control Authorities (SFT).
The national air emissions data set is distributed by source (such as process emissions, stationary and mobile combustion), independent of which industries that are doing the activity. The data set is based on a geographic definition of Norway, excluding activities not on national territory even when done by units that are resident in Norway.
The NAMEA data are distributed by industry, so as to enable a comparison of economic activity and environmental impacts. NAMEA-data uses an economic definition of Norway, which is the same as the one used for the national accounts, and is not strictly observing the geographical borders of mainland Norway. A consequence is that Ocean transport, which is an important part of the Norwegian GDP, should be included. In the results shown in this article, we have had to make some exceptions to this, as the assessment of emissions from this industry is particularly uncertain. These emissions are, however, included in the pie graph above to show the importance of this industry.
Improvements of the compilations
In previous publications, emissions of HCF, PCF and SF6 could not be included in the NAMEA accounts. The good news this year is that these emissions are now included and entered in to the figures and tables for the full time series. In this way, we get an improved picture of the economic activities as compared to emissions of greenhouse gases than in previous publications. This is an improvement particularly for the Manufacturing industries.
Additional data from the Norwegian Environmental Accounts is available at StatBank .
Tables:
Additional information
Contact
-
Ingrid Semb Weyer
E-mail: ingrid.semb.weyer@ssb.no
tel.: (+47) 40 90 23 51
-
Trine Heill Braathu Randen
E-mail: trine.heill.braathu.randen@ssb.no
tel.: (+47) 91 10 67 45

