Content
Published:
This is an archived release.
Economy grew again more than air emissions
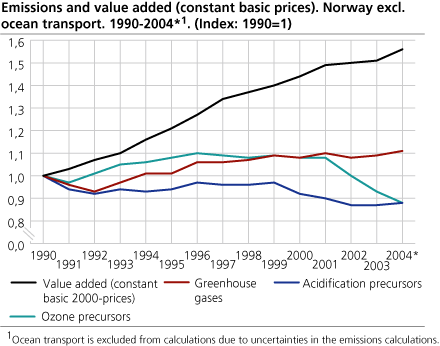
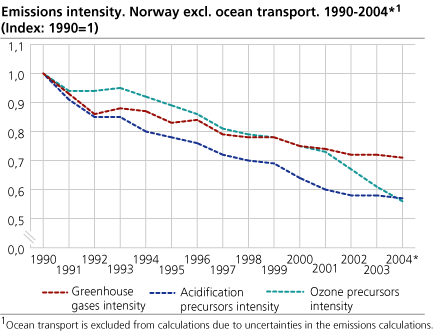
In 2004, greenhouse gas emissions and acidification precursors continued to increase, however, the economic growth was even larger. This resulted in a decrease in the emissions intensity for Norway as a whole. The growth in value added has primarily occurred in industries which are the least emissions intensive.
Combining national accounts data and emission statistics at the level of specific industries can be used to calculate emission intensities (measured as emissions in tons per NOK value added) using data from the so called NAMEA framework (National Account Matrix including Environmental Accounts). An industry is more emissions efficient when its emissions intensity goes down.
For 2004, the NAMEA accounts showed that, in contrast to the year before, the economy grew faster than emissions of greenhouse gasses and acidification precursors. While the emissions of greenhouse gasses and acidification precursors increased from the previous year, emissions of ozone precursors continued to decrease.
Increased economic growth in the least emissions intensive industries
During the period 1990 to 2004, Norway has become more emissions efficient with respect to emissions of greenhouse gases, acidification precursors, and ozone precursors. This does not necessarily mean that all industries have become more emissions efficient, but that increases in value added have occurred particularly in industries that are more emissions intensive.
Preliminary figures for 2004 show that the development of greenhouse gas intensity and acidification intensity has improved slightly from the previous year. Emissions of greenhouse gases and acidification gases continue to increase, but the economic growth again was higher than the increases in these types of emissions. The emissions intensity for ozone precursors also continued to decrease in 2004. The main reason for this is that the emissions of ozone precursors have been reduced while the value added has increased.
Preliminary figures from the national accounts for 2004 show an increase in the value added in constant basic prices of 2.8 per cent from the previous year. The economic growth has particularly been in wholesale and resale trade, construction and other services. These are industries that contribute to a relatively small share of total emissions to air.
Transportation industry more emissions efficient
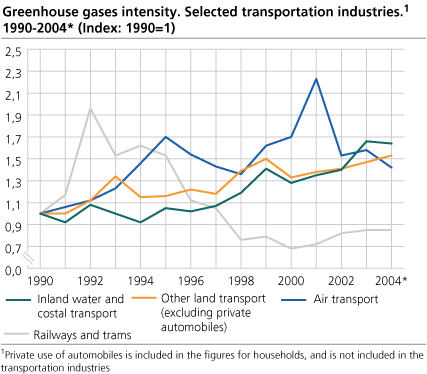
The transportation industry continues to be more emissions efficient, even though greenhouse gases, acidification precursors and ozone precursors have increased from 2003 to 2004 after they showed a decrease for the two previous years. The improvement in emissions efficiency is due primarily to an increase in value added in 2004 compared with the year before. Increases in value added were seen particularly in transport via pipelines, air transport and land transport.
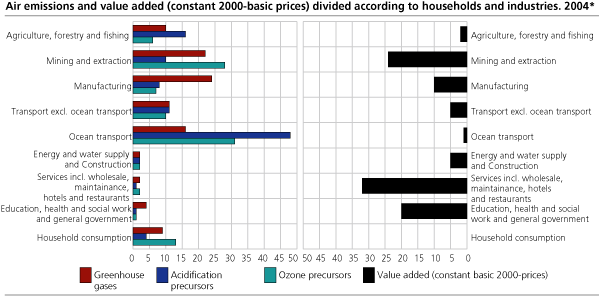
The transportation industry has historically been responsible for a large proportion of the air emissions and in 2004 the industry contributed 27 per cent of total greenhouse gas emissions, 59 per cent of total acidification precursor emissions and 43 per cent of total emissions of ozone precursors. The transportation industries’ contribution to total value added in 2004 was 6 per cent. This makes the transportation industry among the most pollution intensive industries in the Norwegian economy.
but not equally positive for all transportation industries
The transportation industry is composed of different types of transportation industries which are very different with regards to how much they pollute and how much they contribute to creating value added in Norway. The individual transport industries can therefore show very different trends than the transportation industry seen as a whole.
Ocean transport singles itself out in the Norwegian economy when comparing value added and air emissions. The industry contributes little to the production of value added in Norway, but is responsible for a high proportion of total emissions to air. Calculations show that the activity from ocean transport in 2004 contributed to 16 per cent of total greenhouse gas emissions, 48 per cent of total acidification precursors and 31 per cent of total ozone precursors. In 2004 emissions from ocean transport increased slightly while the value added decreased.
Calculations for emissions for ocean transport are included in the bar diagram to illustrate the importance of this industry in the Norwegian context, but because of the uncertainty in the emission calculations for ocean transport, we have chosen to exclude this industry from the general discussion regarding the transportation industry.
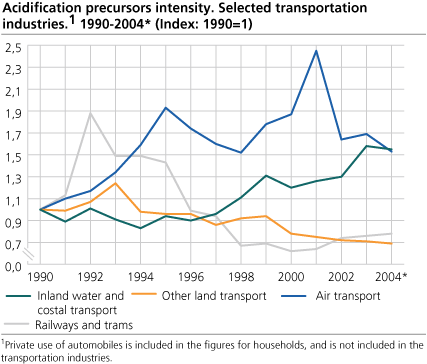
Inland water and coastal transport and other land transport (taxi operation, scheduled motor bus transport and other land transport by roads) account for the largest portion of the transportation industries' emissions of greenhouse gases and acidification precursors. Private use of automobiles is included in the figures for households, and is not included in the transportation industries.
For 2004, both the emissions and value added have decreased for inland water and coastal transport when compared with the year before. Calculations also show that this industry has become more emissions efficient in the last year. But this picture is not representative for the industry if we look over the entire period from 1990 until 2004. During this period, value added for inland water and coastal transport went down, while the emissions of greenhouse gases and acidification precursors have increased.
The industry other land transport continues to be more emissions efficient for acidification precursors, but less emissions efficient for greenhouse gases. After a relatively high level of emissions of acidification precursors at the end of the 1990s, in 2004 the emissions from the land transportation industry have almost been reduced to the 1990-level, while at the same time, value added has increased. This development is due first of all to the reductions of NOX from land transport, which also should be seen in combination with the fact that newer diesel vehicles emit less NOX per kilometer driven than older diesel vehicles. Reductions in emissions of SO2 have also contributed to the reductions in acidification precursors. On the contrary, emissions of greenhouse gases have continued to increase at a higher level than value added from the land transport industry. Growth in greenhouse gas emissions is due to an increase in the level of activities.
Positive and negative for the oil and natural gas extraction industry
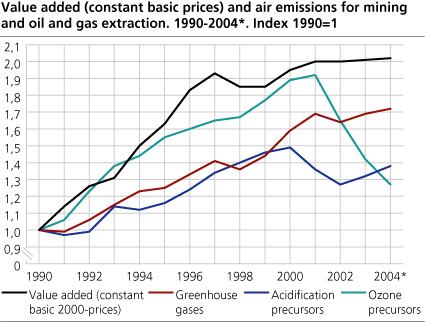
Even though the oil and gas extraction industries including mining account for a large proportion of total air emissions in Norway, these industries are not among the most emissions intensive industries. This is because the oil and gas extraction industries also account for a large proportion of total value added. In 2004 the extraction industries accounted for 24 per cent of total value added.
Since 2001 these industries have been more emissions efficient with regards to emissions of ozone precursors. Recycling of crude oil vapours during the loading and storage of crude oil at offshore facilities at the beginning of the 2000s, is the main reason that the total emissions of NMVOCs have been substantially reduced in the last years. In 2004, NMVOC emissions accounted for 31 per cent of ozone precursors and more than half of the NMVOC emissions in Norway came from the oil and gas extraction industry.
The situation for the emissions of greenhouse gases and acidification precursors from the oil and gas extraction industry is different. Greenhouse gas emissions from the continental shelf have increased consistently since 1990. While the oil and gas extraction industry was more emissions efficient in the early 1990s, calculations for the last year show that this trend is changing. This is primarily due to the fact that value added has flattened out, while emissions of greenhouse gases continue to increase. The relatively high increase in greenhouse gas emissions from 2000 can be seen in combination with the growth in the energy demanding production of natural gas compared with oil production. The production of natural gas gives more greenhouse gas emissions and acidification precursor emissions per produced unit than oil production. Therefore, the emissions efficiency for greenhouse gases and acidification gases in the oil and gas extraction industry has worsened in the last three years.
Manufacturing industry more emissions efficient even with increased greenhouse gas emissions
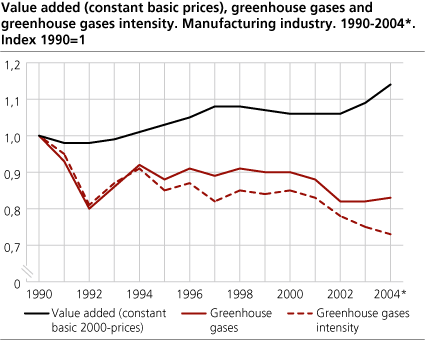
In spite of contributing a large proportion of total greenhouse gas emissions and relatively low proportion of total value added, the calculations show that the manufacturing industries in the years after 1996 have become more emissions efficient even though there was a small increase in the amount of emissions in 2003 and 2004. It is not surprising that the basic metals industry, refined petroleum products, chemical and mineral products industries were responsible to a large degree for the trends in greenhouse gas emissions from the Norwegian manufacturing industry. In 2003 and 2004, increases in the value added are high in the publishing and printing industries and the machinery and other equipment industry.
The economic picture of the manufacturing industry is complex, and the increase in the economic growth can be due to several factors. In 2003, there was a decrease in the number of manufacturing establishments, and the existing establishments were the most profitable ones. In some of the manufacturing industries, for example, the basic metals industry, income increased more than costs. This is due, among other things, to investments in new equipment, which has resulted in increased production capacity and better utilisation of raw materials.
Households consume and throw out more
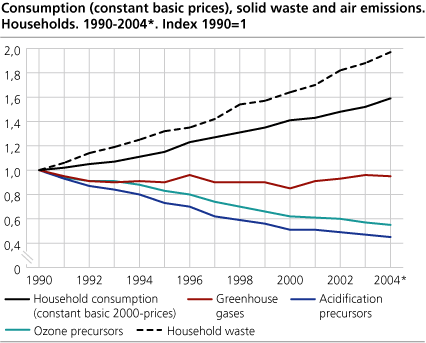
Both household consumption and total amount of household waste have increased substantially and in about the same rate from 2003 to 2004. Increased household consumption is due primarily to an increase in consumption of clothes and shoes, purchases of means of transport, together with other types of goods such as photography and computer equipment, leisure equipment, furniture and household appliances.
Acidification precursor and ozone precursor emissions from household activities were reduced in 2004 compared with the previous year. It is particularly emissions from gasoline powered privately owned cars which have been reduced in spite of the increase in traffic. NOX emissions continue to go down since older cars without catalytic converters are being scrapped and the proportion of cars with catalytic converters continues to increase. The number of diesel powered privately owned cars continues to increase and it is expected that this will slightly reduce the decrease in NOx emissions in the future. Air emissions of NOX from diesel powered cars is somewhat higher per kilometer driven than for gasoline powered cars with catalytic converters, however, the opposite is true for CO2.
After a period of five years with continuously increasing greenhouse gas emissions from households, the figures show a slight decrease for 2004. Greenhouse gas emissions from households are due primarily to the use of fuel in privately owned cars and also from the use of fuel oil for heating. Although the greenhouse gas emissions from households' automobile driving increased from 2003 to 2004, there has been a decrease in CO2 emissions from heating, which combined, results in an overall decrease in total greenhouse gas emissions from households.
|
Different definitions
Combining data from the national accounts and environmental statistics is made into a standard framework named NAMEA (National Account Matrix including Environmental Accounts). For further information consult About the statistics ). The NAMEA data are distributed by industry, so as to enable a comparison of economic activity and environmental impacts. NAMEA-data uses an economic definition of Norway, which is the same as the one used for the national accounts. Ocean transport and international air transport are therefore included. The NAMEA-data is reported to the EU. There are essential differences between the Norwegian NAMEA emissions data and the national data on air emissions that are published by Statistics Norway and the Norwegian Pollution Control Authorities (SFT). The national air emissions data set is distributed by source (such as process emissions, stationary and mobile combustion), independent of which industries that are doing the activity. The data set is based on a geographic definition of Norway. This means that ocean transport and international air transport are excluded, in line with the international air emissions agreements. |
Additional data from the Norwegian Environmental Accounts are available at StatBank .
Tables:
Additional information
Contact
-
Ingrid Semb Weyer
E-mail: ingrid.semb.weyer@ssb.no
tel.: (+47) 40 90 23 51
-
Trine Heill Braathu Randen
E-mail: trine.heill.braathu.randen@ssb.no
tel.: (+47) 91 10 67 45

