Content
Published:
This is an archived release.
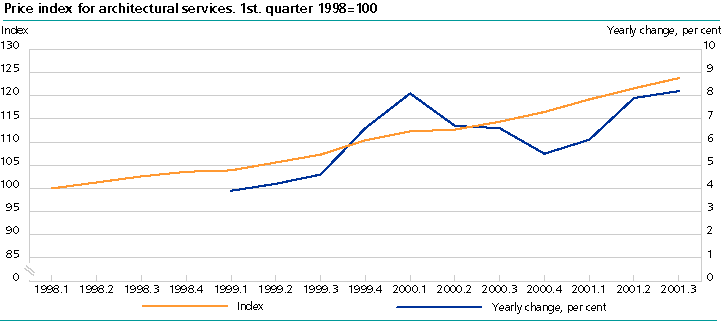
Price of architectural services up 8 per cent
The year-to-year growth in the price of architectural services was 8.2 per cent in the 3rd. quarter of 2001.
The increase in the price of architectural services from the 3rd quarter in 2000 to the 3rd quarter this year is a record high, but the growth of 1.8 per cent from the 2nd to the 3rd quarter this year is less than the growth from the 1st quarter to the 2nd quarter of 2001.
|
Price-, turnover and volume indices for architectural services.
1. quarter 1998-3. quarter 2001 |
| Period | Prices | Turnover | Volume | ||||||||||||||||||||||||||||||||||||
|---|---|---|---|---|---|---|---|---|---|---|---|---|---|---|---|---|---|---|---|---|---|---|---|---|---|---|---|---|---|---|---|---|---|---|---|---|---|---|---|
| Index |
Change from
previous year |
Index |
Change from
previous year |
Index |
Change from
previous year |
||||||||||||||||||||||||||||||||||
| Per cent | Per cent | Per cent | |||||||||||||||||||||||||||||||||||||
| 1998 | 101,9 | 104,3 | 102,3 | ||||||||||||||||||||||||||||||||||||
| 1999 | 106,8 | 4,8 | 111,9 | 7,2 | 104,6 | 2,2 | |||||||||||||||||||||||||||||||||
| 2000 | 114,0 | 6,7 | 124,8 | 11,6 | 109,4 | 4,6 | |||||||||||||||||||||||||||||||||
| 1998 | |||||||||||||||||||||||||||||||||||||||
| 1. quarter | 100,0 | 100,0 | 100,0 | ||||||||||||||||||||||||||||||||||||
| 2. quarter | 101,3 | 107,6 | 106,2 | ||||||||||||||||||||||||||||||||||||
| 3. quarter | 102,6 | 91,5 | 89,3 | ||||||||||||||||||||||||||||||||||||
| 4. quarter | 103,6 | 118,0 | 113,9 | ||||||||||||||||||||||||||||||||||||
| 1999 | |||||||||||||||||||||||||||||||||||||||
| 1. quarter | 103,9 | 3,9 | 105,1 | 4,8 | 101,2 | 1,1 | |||||||||||||||||||||||||||||||||
| 2. quarter | 105,6 | 4,3 | 113,0 | 5,9 | 107,0 | 0,9 | |||||||||||||||||||||||||||||||||
| 3. quarter | 107,3 | 4,6 | 98,4 | 5,8 | 91,7 | 2,2 | |||||||||||||||||||||||||||||||||
| 4. quarter | 110,4 | 6,5 | 130,9 | 12,3 | 118,5 | 4,5 | |||||||||||||||||||||||||||||||||
| 2000 | |||||||||||||||||||||||||||||||||||||||
| 1. quarter | 112,3 | 8,1 | 119,6 | 12,8 | 106,5 | 5,0 | |||||||||||||||||||||||||||||||||
| 2. quarter | 112,7 | 6,6 | 120,6 | 7,7 | 107,0 | 0,0 | |||||||||||||||||||||||||||||||||
| 3. quarter | 114,4 | 6,7 | 106,2 | 5,9 | 92,8 | 0,9 | |||||||||||||||||||||||||||||||||
| 4. quarter | 116,5 | 5,5 | 152,9 | 16,9 | 131,3 | 10,7 | |||||||||||||||||||||||||||||||||
| 2001 | |||||||||||||||||||||||||||||||||||||||
| 1. quarter | 119,2 | 6,1 | |||||||||||||||||||||||||||||||||||||
| 2. quarter | 121,6 | 7,9 | |||||||||||||||||||||||||||||||||||||
| 3. quarter | 123,8 | 8,2 | |||||||||||||||||||||||||||||||||||||
The statistics is published with Producer price indices for services.
Contact
-
Statistics Norway's Information Centre
E-mail: informasjon@ssb.no
tel.: (+47) 21 09 46 42

