Content
Published:
This is an archived release.
Slow rise in pricing of architectural services
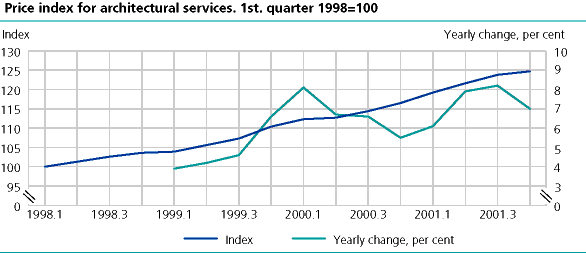
In 2001 the prices of architectural services increased by 7.3 per cent
During the 4t h quarter in 2001 the prices of architectural services rose by 7.0 per cent.
|
Price, turnover and volume indices for architectural services.
1. quarter 1998-4. quarter 2001. 1. quarter 1998=100 |
| Prices | Turnover | Volume | |||||||||||||||||||||||||||||||||||||
|---|---|---|---|---|---|---|---|---|---|---|---|---|---|---|---|---|---|---|---|---|---|---|---|---|---|---|---|---|---|---|---|---|---|---|---|---|---|---|---|
| Periode | Index |
Change from
previous year |
Index |
Change from
previous year |
Index |
Change from
previous year |
|||||||||||||||||||||||||||||||||
| Per cent | Per cent | Per cent | |||||||||||||||||||||||||||||||||||||
| 1998 | 101.9 | 104.3 | 102.3 | ||||||||||||||||||||||||||||||||||||
| 1999 | 106.8 | 4.8 | 111.9 | 7.2 | 104.6 | 2.2 | |||||||||||||||||||||||||||||||||
| 2000 | 114.0 | 6.7 | 124.8 | 11.6 | 109.4 | 4.6 | |||||||||||||||||||||||||||||||||
| 2001 | 122.3 | 7.3 | |||||||||||||||||||||||||||||||||||||
| 1998 | |||||||||||||||||||||||||||||||||||||||
| 1. quarter | 100.0 | 100.0 | 100.0 | ||||||||||||||||||||||||||||||||||||
| 2. quarter | 101.3 | 107.6 | 106.2 | ||||||||||||||||||||||||||||||||||||
| 3. quarter | 102.6 | 91.5 | 89.3 | ||||||||||||||||||||||||||||||||||||
| 4. quarter | 103.6 | 118.0 | 113.9 | ||||||||||||||||||||||||||||||||||||
| 1999 | |||||||||||||||||||||||||||||||||||||||
| 1. quarter | 103.9 | 3.9 | 105.1 | 4.8 | 101.2 | 1.1 | |||||||||||||||||||||||||||||||||
| 2. quarter | 105.6 | 4.3 | 113.0 | 5.9 | 107.0 | 0.9 | |||||||||||||||||||||||||||||||||
| 3. quarter | 107.3 | 4.6 | 98.4 | 5.8 | 91.7 | 2.2 | |||||||||||||||||||||||||||||||||
| 4. quarter | 110.4 | 6.5 | 130.9 | 12.3 | 118.5 | 4.5 | |||||||||||||||||||||||||||||||||
| 2000 | |||||||||||||||||||||||||||||||||||||||
| 1. quarter | 112.3 | 8.1 | 119.6 | 12.8 | 106.5 | 5.0 | |||||||||||||||||||||||||||||||||
| 2. quarter | 112.7 | 6.6 | 120.6 | 7.7 | 107.0 | 0.0 | |||||||||||||||||||||||||||||||||
| 3. quarter | 114.4 | 6.7 | 106.2 | 5.9 | 92.8 | 0.9 | |||||||||||||||||||||||||||||||||
| 4. quarter | 116.5 | 5.5 | 152.9 | 16.9 | 131.3 | 10.7 | |||||||||||||||||||||||||||||||||
| 2001 | |||||||||||||||||||||||||||||||||||||||
| 1. quarter | 119.2 | 6.1 | |||||||||||||||||||||||||||||||||||||
| 2. quarter | 121.6 | 7.9 | |||||||||||||||||||||||||||||||||||||
| 3. quarter | 123.8 | 8.2 | |||||||||||||||||||||||||||||||||||||
| 4. quarter | 124.7 | 7.0 | |||||||||||||||||||||||||||||||||||||
The statistics is published with Producer price indices for services.
Contact
-
Statistics Norway's Information Centre
E-mail: informasjon@ssb.no
tel.: (+47) 21 09 46 42

