Content
Published:
This is an archived release.
Prices of architectural services up 6 per cent
The prices of architectural services increased by 6 per cent from the second quarter of 2007 to the second quarter of 2008. This is the same annual increase as last quarter.
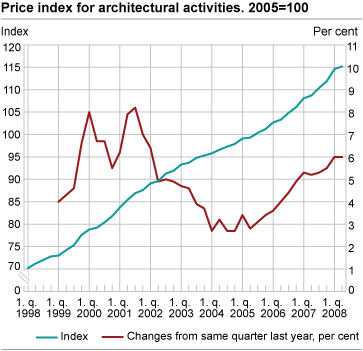
From the first to the second quarter of 2008 the prices of architectural services increased by 0.5 per cent.
Since Statistics Norway started to publish the index in the first quarter of 1998, the prices have increased by 64.1 per cent. The complete time series is in the StatBank .
| Periode | Prices | Turnover | Volume | ||||||||||||||||||||||||||||||||||||
|---|---|---|---|---|---|---|---|---|---|---|---|---|---|---|---|---|---|---|---|---|---|---|---|---|---|---|---|---|---|---|---|---|---|---|---|---|---|---|---|
| Index |
Changes from same
quarter last year, per cent |
Index1 |
Change from same
quarter last year, per cent |
Index1 |
Change from same
quarter last year, per cent |
||||||||||||||||||||||||||||||||||
| 1998 | 71.6 | ||||||||||||||||||||||||||||||||||||||
| 1999 | 75.0 | 4.8 | |||||||||||||||||||||||||||||||||||||
| 2000 | 80.1 | 6.7 | |||||||||||||||||||||||||||||||||||||
| 2001 | 85.9 | 7.3 | |||||||||||||||||||||||||||||||||||||
| 2002 | 90.5 | 5.3 | 86.1 | 95.1 | |||||||||||||||||||||||||||||||||||
| 2003 | 94.3 | 4.2 | 82.5 | -4.2 | 87.5 | -8.0 | |||||||||||||||||||||||||||||||||
| 2004 | 97.0 | 2.8 | 88.0 | 6.7 | 90.7 | 3.7 | |||||||||||||||||||||||||||||||||
| 2005 | 100.0 | 3.1 | 100.0 | 13.6 | 100.0 | 10.2 | |||||||||||||||||||||||||||||||||
| 2006 | 104.2 | 4.2 | 115.7 | 15.7 | 111.0 | 11.0 | |||||||||||||||||||||||||||||||||
| 2007 | 109.8 | 5.4 | 132.4 | 14.4 | 120.6 | 8.6 | |||||||||||||||||||||||||||||||||
| 2002 | |||||||||||||||||||||||||||||||||||||||
| 1. quarter | 89.1 | 6.4 | 79.9 | 89.7 | |||||||||||||||||||||||||||||||||||
| 2. quarter | 89.6 | 4.9 | 89.1 | 99.4 | |||||||||||||||||||||||||||||||||||
| 3. quarter | 91.3 | 5.0 | 72.6 | 79.6 | |||||||||||||||||||||||||||||||||||
| 4. quarter | 91.9 | 4.9 | 103.0 | 112.0 | |||||||||||||||||||||||||||||||||||
| 2003 | |||||||||||||||||||||||||||||||||||||||
| 1. quarter | 93.3 | 4.7 | 80.4 | 0.7 | 86.2 | -3.8 | |||||||||||||||||||||||||||||||||
| 2. quarter | 93.7 | 4.6 | 83.4 | -6.4 | 89.0 | -10.5 | |||||||||||||||||||||||||||||||||
| 3. quarter | 94.8 | 3.9 | 67.0 | -7.7 | 70.7 | -11.1 | |||||||||||||||||||||||||||||||||
| 4. quarter | 95.3 | 3.7 | 99.1 | -3.7 | 104.0 | -7.2 | |||||||||||||||||||||||||||||||||
| 2004 | |||||||||||||||||||||||||||||||||||||||
| 1. quarter | 95.8 | 2.7 | 81.2 | 0.9 | 84.7 | -1.8 | |||||||||||||||||||||||||||||||||
| 2. quarter | 96.6 | 3.2 | 86.8 | 4.2 | 89.9 | 1.0 | |||||||||||||||||||||||||||||||||
| 3. quarter | 97.3 | 2.7 | 71.9 | 7.3 | 73.9 | 4.4 | |||||||||||||||||||||||||||||||||
| 4. quarter | 97.9 | 2.7 | 112.1 | 13.1 | 114.5 | 10.1 | |||||||||||||||||||||||||||||||||
| 2005 | |||||||||||||||||||||||||||||||||||||||
| 1. quarter | 99.1 | 3.4 | 85.3 | 5.1 | 86.1 | 1.5 | |||||||||||||||||||||||||||||||||
| 2. quarter | 99.3 | 2.8 | 102.8 | 18.4 | 103.5 | 15.2 | |||||||||||||||||||||||||||||||||
| 3. quarter | 100.4 | 3.1 | 82.7 | 15.0 | 82.4 | 11.5 | |||||||||||||||||||||||||||||||||
| 4. quarter | 101.2 | 3.4 | 129.3 | 15.3 | 127.8 | 11.6 | |||||||||||||||||||||||||||||||||
| 2006 | |||||||||||||||||||||||||||||||||||||||
| 1. quarter | 102.7 | 3.6 | 104.9 | 23.0 | 102.1 | 18.8 | |||||||||||||||||||||||||||||||||
| 2. quarter | 103.3 | 4.0 | 111.1 | 8.1 | 107.5 | 3.9 | |||||||||||||||||||||||||||||||||
| 3. quarter | 104.8 | 4.4 | 96.3 | 16.4 | 91.9 | 11.6 | |||||||||||||||||||||||||||||||||
| 4. quarter | 106.1 | 4.9 | 150.5 | 16.4 | 141.8 | 10.5 | |||||||||||||||||||||||||||||||||
| 2007 | |||||||||||||||||||||||||||||||||||||||
| 1. quarter | 108.1 | 5.3 | 123.1 | 17.3 | 113.9 | 11.5 | |||||||||||||||||||||||||||||||||
| 2. quarter | 108.7 | 5.2 | 128.6 | 15.8 | 118.3 | 10.0 | |||||||||||||||||||||||||||||||||
| 3. quarter | 110.4 | 5.3 | 109.2 | 13.4 | 98.9 | 7.6 | |||||||||||||||||||||||||||||||||
| 4. quarter | 111.9 | 5.5 | 168.7 | 12.1 | 150.8 | 6.4 | |||||||||||||||||||||||||||||||||
| 2008 | |||||||||||||||||||||||||||||||||||||||
| 1. quarter | 114.6 | 6.0 | 133.7 | 8.6 | 116.7 | 2.5 | |||||||||||||||||||||||||||||||||
| 2. quarter | 115.2 | 6.0 | : | : | : | : | |||||||||||||||||||||||||||||||||
| 1 |
Data is collected from the VAT register. There is a certain time lag in the reporting to the
Tax Directorate. As a result, the turnover index and the volume index might be revised in subsequent releases. |
The statistics is published with Producer price indices for services.
Contact
-
Statistics Norway's Information Centre
E-mail: informasjon@ssb.no
tel.: (+47) 21 09 46 42