Content
Published:
This is an archived release.
New price index for car rental
For the first time, Statistics Norway has published a price index for car rental. The index is quarterly, and the first publication covers statistics from the 1st quarter of 2004 to the 3rd quarter of 2005.
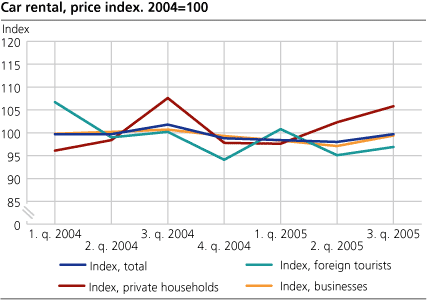
The prices for car rental have changed relatively little during the seven quarters we have figures for. The index increased somewhat in the first part of 2004. From the 3rd quarter of 2004 to the 2nd quarter of 2005 the index decreased. In the 3rd quarter of 2005 the index increased again and showed a price level that was identical with the level in the 1st quarter of 2004.
The total index consists of three sub-indices. We have made one sub-index for the following three groups of customers: foreign tourists, private households, and private and public enterprises. The sub-index for private households shows some signs of seasonal pattern, with the highest price levels in the 3rd quarter. The sub-index for foreign tourists shows that the prices within this category of customers are highest in the 1st quarter.
| Car rental , price index. 1st quarter 2004-3rd quarter 2005. 2004=100 |
| Period | Prices | Sub-indices | |||||||||||||||||||||||||||||||||||||
|---|---|---|---|---|---|---|---|---|---|---|---|---|---|---|---|---|---|---|---|---|---|---|---|---|---|---|---|---|---|---|---|---|---|---|---|---|---|---|---|
| Total index |
Changes from same
quarter last year. Per cent |
Foreign
tourists |
Households/
private persons |
Private and
public businesses |
|||||||||||||||||||||||||||||||||||
| 2004 | 100.0 | 100.0 | 100.0 | 100.0 | |||||||||||||||||||||||||||||||||||
| 2004 | |||||||||||||||||||||||||||||||||||||||
| 1. quarter | 99.7 | 106.7 | 96.1 | 99.8 | |||||||||||||||||||||||||||||||||||
| 2. quarter | 99.7 | 99.0 | 98.4 | 100.2 | |||||||||||||||||||||||||||||||||||
| 3. quarter | 101.8 | 100.2 | 107.6 | 100.7 | |||||||||||||||||||||||||||||||||||
| 4. quarter | 98.8 | 94.1 | 97.8 | 99.3 | |||||||||||||||||||||||||||||||||||
| 2005 | |||||||||||||||||||||||||||||||||||||||
| 1. quarter | 98.4 | -1.3 | 100.8 | 97.6 | 98.3 | ||||||||||||||||||||||||||||||||||
| 2. quarter | 98.0 | -1.7 | 95.1 | 102.3 | 97.1 | ||||||||||||||||||||||||||||||||||
| 3. quarter | 99.7 | -2.1 | 96.9 | 105.8 | 99.4 | ||||||||||||||||||||||||||||||||||
In the period we are publishing figures for, the private and public enterprises constitute 70 per cent of the turnover on average. Private households and foreign tourists constitute 18 and 12 per cent respectively.
The statistics is published with Producer price indices for services.
Contact
-
Statistics Norway's Information Centre
E-mail: informasjon@ssb.no
tel.: (+47) 21 09 46 42

