Content
Published:
This is an archived release.
Stable car rental prices
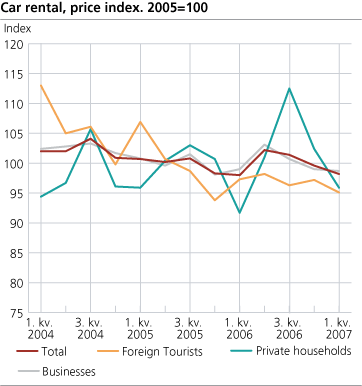
From the first quarter of 2006 to the first quarter of 2007, the prices of car rental increased by 0.2 per cent. However, the prices decreased compared with the fourth quarter of 2006.
The total index consists of three sub-indices. Only the sub-index for private households increased in the period from the first quarter of 2006 to the same quarter in 2007. Prices for foreign tourists and private and public enterprises showed a small decrease in the same period.
In the first quarter of 2007, the private and public enterprises constitute 80 per cent of the total turnover. Private households and foreign tourists constitute 14 and 6 per cent respectively.
| Car rental , price index 1st quarter 2004-1st quarter 2007. 2005=100 |
| Periode | Prices | Sub-indices | |||||||||||||||||||||||||||||||||||||
|---|---|---|---|---|---|---|---|---|---|---|---|---|---|---|---|---|---|---|---|---|---|---|---|---|---|---|---|---|---|---|---|---|---|---|---|---|---|---|---|
| Total Index |
Changes from same
quarter last year, per cent |
Foreign tourists |
Households/
private persons |
Private and
public businesses |
|||||||||||||||||||||||||||||||||||
| 2004 | 102.0 | 104.9 | 98.0 | 102.5 | |||||||||||||||||||||||||||||||||||
| 2005 | 100.0 | 100.0 | 100.0 | 100.0 | |||||||||||||||||||||||||||||||||||
| 2006 | 100.3 | 97.2 | 101.9 | 100.4 | |||||||||||||||||||||||||||||||||||
| 2004 | |||||||||||||||||||||||||||||||||||||||
| 1. quarter | 102.0 | 113.0 | 94.4 | 102.4 | |||||||||||||||||||||||||||||||||||
| 2. quarter | 102.0 | 105.0 | 96.7 | 102.8 | |||||||||||||||||||||||||||||||||||
| 3. quarter | 104.1 | 106.1 | 105.7 | 103.3 | |||||||||||||||||||||||||||||||||||
| 4. quarter | 100.9 | 99.8 | 96.1 | 101.7 | |||||||||||||||||||||||||||||||||||
| 2005 | |||||||||||||||||||||||||||||||||||||||
| 1. quarter | 100.7 | -1.3 | 106.9 | 95.9 | 100.8 | ||||||||||||||||||||||||||||||||||
| 2. quarter | 100.2 | -1.8 | 100.7 | 100.4 | 99.6 | ||||||||||||||||||||||||||||||||||
| 3. quarter | 100.8 | -3.1 | 98.7 | 103.0 | 101.5 | ||||||||||||||||||||||||||||||||||
| 4. quarter | 98.3 | -2.6 | 93.8 | 100.7 | 98.1 | ||||||||||||||||||||||||||||||||||
| 2006 | |||||||||||||||||||||||||||||||||||||||
| 1. quarter | 98.0 | -2.6 | 97.3 | 91.7 | 99.0 | ||||||||||||||||||||||||||||||||||
| 2. quarter | 102.2 | 2.0 | 98.2 | 101.0 | 103.1 | ||||||||||||||||||||||||||||||||||
| 3. quarter | 101.4 | 0.6 | 96.3 | 112.5 | 100.7 | ||||||||||||||||||||||||||||||||||
| 4. quarter | 99.6 | 1.3 | 97.2 | 102.4 | 99.0 | ||||||||||||||||||||||||||||||||||
| 2007 | |||||||||||||||||||||||||||||||||||||||
| 1. quarter | 98.2 | 0.2 | 95.1 | 95.9 | 98.7 | ||||||||||||||||||||||||||||||||||
About the car rental industryThe car rental industry consisted of 438 businesses in 2005. These businesses employed 1 006 persons and had a turnover of almost NOK 2.2 billion, according to figures from Statistics Norway’s structural statistics. Data sourcesStatistics Norway receives data from the four larges chains in the industry. Theses four chains are reporting data from a total of 350 businesses/offices. AnalysisThree sub-indices are calculated. One index is calculated for foreign tourists, one for private households and one for private and public enterprises. These sub-indices are weighted together to a total index for car rental. The weights used are the income per type of customer from each of the chains in the quarter in question. The price measuredThe price measured is price per day of rental. The price includes possible extra charge for additional time/distance, insurance, possible airport tax or other extra costs. VAT, fuel costs and possible one way fee are not included. Time of measurementThe statistics consists of all the transactions that the chains have carried through in the quarter in question. |
The statistics is published with Producer price indices for services.
Contact
-
Statistics Norway's Information Centre
E-mail: informasjon@ssb.no
tel.: (+47) 21 09 46 42

