Content
Published:
This is an archived release.
Cheaper car rental in 2007
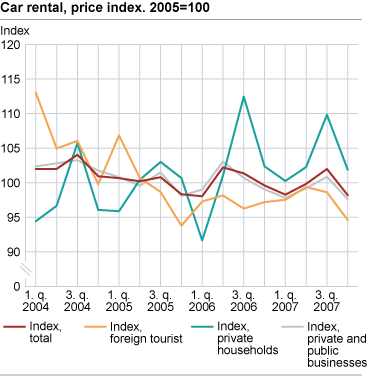
2007 was the cheapest year to rent cars since the recording of prices began in 2004. In the fourth quarter of 2007, business customers and foreign tourists in particular paid lower prices.
In the last few years, car rental prices have often been lower in the fourth quarter and this was also the case in 2007. The total index shows a 1.4 per cent decrease compared with the fourth quarter of 2006. For foreign tourists, the decrease was 2.7 per cent, which resulted in the lowest price level in two years. Private households were charged approximately the same prices as in the previous year. Business customers accounted for 80 per cent of the market turnover and experienced a 1.4 per cent decrease in prices compared with the fourth quarter of 2006. Foreign tourists and private households accounted for 5.4 per cent and 14.6 per cent of the turnover respectively.
| Period | Prices | Sub indices | |||||||||||||||||||||||||||||||||||||
|---|---|---|---|---|---|---|---|---|---|---|---|---|---|---|---|---|---|---|---|---|---|---|---|---|---|---|---|---|---|---|---|---|---|---|---|---|---|---|---|
| Total index |
Changes from
same quarter in the previous year, per cent |
Foreign
tourists |
Private
households |
Private and
public businesses |
|||||||||||||||||||||||||||||||||||
| 2004 | |||||||||||||||||||||||||||||||||||||||
| 1. quarter | 102.0 | 113.0 | 94.4 | 102.4 | |||||||||||||||||||||||||||||||||||
| 2. quarter | 102.0 | 105.0 | 96.7 | 102.8 | |||||||||||||||||||||||||||||||||||
| 3. quarter | 104.1 | 106.1 | 105.7 | 103.3 | |||||||||||||||||||||||||||||||||||
| 4. quarter | 100.9 | 99.8 | 96.1 | 101.7 | |||||||||||||||||||||||||||||||||||
| 2005 | |||||||||||||||||||||||||||||||||||||||
| 1. quarter | 100.7 | -1.3 | 106.9 | 95.9 | 100.8 | ||||||||||||||||||||||||||||||||||
| 2. quarter | 100.2 | -1.8 | 100.7 | 100.4 | 99.6 | ||||||||||||||||||||||||||||||||||
| 3. quarter | 100.8 | -3.1 | 98.7 | 103.0 | 101.5 | ||||||||||||||||||||||||||||||||||
| 4. quarter | 98.3 | -2.6 | 93.8 | 100.7 | 98.1 | ||||||||||||||||||||||||||||||||||
| 2006 | |||||||||||||||||||||||||||||||||||||||
| 1. quarter | 98.0 | -2.6 | 97.3 | 91.7 | 99.0 | ||||||||||||||||||||||||||||||||||
| 2. quarter | 102.2 | 2.0 | 98.2 | 101.0 | 103.1 | ||||||||||||||||||||||||||||||||||
| 3. quarter | 101.4 | 0.6 | 96.3 | 112.5 | 100.7 | ||||||||||||||||||||||||||||||||||
| 4. quarter | 99.6 | 1.3 | 97.2 | 102.4 | 99.0 | ||||||||||||||||||||||||||||||||||
| 2007 | |||||||||||||||||||||||||||||||||||||||
| 1. quarter1 | 98.3 | 0.2 | 97.5 | 100.2 | 97.8 | ||||||||||||||||||||||||||||||||||
| 2. quarter1 | 99.8 | -2.3 | 99.4 | 102.3 | 99.2 | ||||||||||||||||||||||||||||||||||
| 3. quarter | 102.0 | 0.6 | 98.6 | 109.8 | 100.9 | ||||||||||||||||||||||||||||||||||
| 4. quarter | 98.2 | -1.4 | 94.6 | 101.9 | 97.6 | ||||||||||||||||||||||||||||||||||
| 1 |
Previously published values have been edited based on new information
from respondents. |
About the car rental industryThe car rental industry consisted of 438 businesses in 2005. These businesses employed 1 006 people and had a turnover of almost NOK 2.2 billion, according to figures from Statistics Norway’s structural statistics. Data sourcesStatistics Norway receives data from the four largest car rental chains in the industry. These four chains report data from a total of 350 businesses/offices. Estimation methodThree sub-indices are calculated. One index is calculated for foreign tourists, one for private households and one for private and public enterprises. These sub-indices are weighted together to form a total index for car rental. The weights used are income per type of customer from each of the chains in the quarter in question. PricesThe price measured is price per day of rental. The price includes possible extra charges for additional rental time/distance driven, insurance, any airport taxes or other extra costs. VAT, fuel costs and one-way fees if applicable are not included. Reference periodThe statistics consists of all transactions in the relevant quarter. |
The statistics is published with Producer price indices for services.
Contact
-
Statistics Norway's Information Centre
E-mail: informasjon@ssb.no
tel.: (+47) 21 09 46 42

