Content
Published:
This is an archived release.
Cheaper car rental this summer
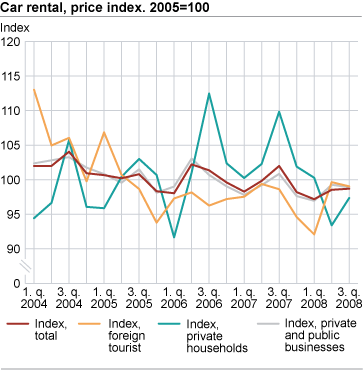
It has become less expensive to rent a car. The prices for car rental was 3.2 per cent lower in the 3rd quarter of 2008 than in the corresponding period last year.
The total index for car rental has normally risen in the summer months, but the figures for the 3r d quarter of 2008 show that the market paid about the same price for car rental during the summer as it did in the 2n d quarter of this year.
Compared with the 3r d quarter last year, it was the private customers who experienced the strongest price decline, 11,4 per cent. The decline was also noticeable for private and public businesses. The business customers experienced a price decrease of almost 2 per cent, while the car rental prices for the foreign tourists were nearly unchanged.
In this quarter, business customers accounted for 55 per cent of the total turnover in the market.
| Period | Prices | Sub indices | |||||||||||||||||||||||||||||||||||||
|---|---|---|---|---|---|---|---|---|---|---|---|---|---|---|---|---|---|---|---|---|---|---|---|---|---|---|---|---|---|---|---|---|---|---|---|---|---|---|---|
| Total index |
Changes from same
quarter in the previous year, per cent |
Foreign tourists | Private households | Private and public businesses | |||||||||||||||||||||||||||||||||||
| 2004 | |||||||||||||||||||||||||||||||||||||||
| 1. quarter | 102.0 | 113.0 | 94.4 | 102.4 | |||||||||||||||||||||||||||||||||||
| 2. quarter | 102.0 | 105.0 | 96.7 | 102.8 | |||||||||||||||||||||||||||||||||||
| 3. quarter | 104.1 | 106.1 | 105.7 | 103.3 | |||||||||||||||||||||||||||||||||||
| 4. quarter | 100.9 | 99.8 | 96.1 | 101.7 | |||||||||||||||||||||||||||||||||||
| 2005 | |||||||||||||||||||||||||||||||||||||||
| 1. quarter | 100.7 | -1.3 | 106.9 | 95.9 | 100.8 | ||||||||||||||||||||||||||||||||||
| 2. quarter | 100.2 | -1.8 | 100.7 | 100.4 | 99.6 | ||||||||||||||||||||||||||||||||||
| 3. quarter | 100.8 | -3.1 | 98.7 | 103.0 | 101.5 | ||||||||||||||||||||||||||||||||||
| 4. quarter | 98.3 | -2.6 | 93.8 | 100.7 | 98.1 | ||||||||||||||||||||||||||||||||||
| 2006 | |||||||||||||||||||||||||||||||||||||||
| 1. quarter | 98.0 | -2.6 | 97.3 | 91.7 | 99.0 | ||||||||||||||||||||||||||||||||||
| 2. quarter | 102.2 | 2.0 | 98.2 | 101.0 | 103.1 | ||||||||||||||||||||||||||||||||||
| 3. quarter | 101.4 | 0.6 | 96.3 | 112.5 | 100.7 | ||||||||||||||||||||||||||||||||||
| 4. quarter | 99.6 | 1.3 | 97.2 | 102.4 | 99.0 | ||||||||||||||||||||||||||||||||||
| 2007 | |||||||||||||||||||||||||||||||||||||||
| 1. quarter1 | 98.3 | 0.2 | 97.5 | 100.2 | 97.8 | ||||||||||||||||||||||||||||||||||
| 2. quarter1 | 99.8 | -2.3 | 99.4 | 102.3 | 99.2 | ||||||||||||||||||||||||||||||||||
| 3. quarter | 102.0 | 0.6 | 98.6 | 109.8 | 100.9 | ||||||||||||||||||||||||||||||||||
| 4. quarter | 98.2 | -1.4 | 94.6 | 101.9 | 97.6 | ||||||||||||||||||||||||||||||||||
| 2008 | |||||||||||||||||||||||||||||||||||||||
| 1. quarter1 | 97.2 | -1.1 | 92.1 | 100.3 | 96.9 | ||||||||||||||||||||||||||||||||||
| 2. quarter1 | 98.5 | -1.3 | 99.6 | 93.4 | 99.3 | ||||||||||||||||||||||||||||||||||
| 3. quarter | 98.7 | -3.2 | 99.0 | 97.3 | 98.9 | ||||||||||||||||||||||||||||||||||
| 1 | Previously published values have been edited based on new information from respondents. |
The statistics is published with Producer price indices for services.
Contact
-
Statistics Norway's Information Centre
E-mail: informasjon@ssb.no
tel.: (+47) 21 09 46 42

