Record prison numbers in 2016
Published:
When examining all types of sentences as a whole, 2016 was a record year for prison numbers.
- Full set of figures
- Imprisonments
- Series archive
- Imprisonments (archive)
When sentences served in institutions, by electronic monitoring, for the non-payment of a fine and remands in custody are taken as a whole, the number of sentences in 2016 was the highest ever. The figures were particularly high for sentences served in institutions, but there was also an increase in the numbers serving sentences for non-payment of a fine and using electronic monitoring.
We see that several trends from previous years have been continued, including in the use of custody and electronic monitoring. The fact that Norgerhaven prison in the Netherlands was part of the Norwegian Correctional Services throughout 2016 presumably has an even greater impact on the statistics on imprisonments in 2016, both in terms of type of imprisonment and those imprisoned.
Over 1 million days served in prison
In 2016, a total of 1 085 000 days were served in prison facilities. This means that on an average day that year, 2 964 persons were serving a sentence in a prison facility. Of these, 2 774 were serving a prison sentence, 89 were in preventive detention and 100 were serving a prison sentence for non-payment of a fine. Overall, this is 3.6 per cent more than in the previous year and as much as 7.7 per cent more than in 2014. As illustrated in figure 1, this is the highest average prison population ever recorded in the time series of the statistics dating back to 1960.
1 Prison sentence by electronic monitoring (2008-2016) not included. The age of criminal responsibility is 14 years until 1989, and 15 years from 1990
Figure 1. Average number of prison population, by type of imprisonment¹
| Custody | Serving sentence for non-payment of a fine | Preventive detention/security detention | Prison sentence, institution | |
| 1960 | 353 | 177 | 1042 | |
| 1961 | 356 | 143 | 1056 | |
| 1962 | 416 | 124 | 1108 | |
| 1963 | 447 | 115 | 1222 | |
| 1964 | 384 | 135 | 1295 | |
| 1965 | 384 | 132 | 84 | 1229 |
| 1966 | 404 | 111 | 79 | 1186 |
| 1967 | 448 | 91 | 73 | 1251 |
| 1968 | 444 | 90 | 68 | 1271 |
| 1969 | 493 | 104 | 68 | 1157 |
| 1970 | 507 | 38 | 58 | 1089 |
| 1971 | 521 | 19 | 46 | 1126 |
| 1972 | 469 | 25 | 55 | 1258 |
| 1973 | 519 | 18 | 60 | 1315 |
| 1974 | 498 | 21 | 41 | 1364 |
| 1975 | 483 | 18 | 26 | 1386 |
| 1976 | 411 | 18 | 26 | 1347 |
| 1977 | 421 | 15 | 21 | 1322 |
| 1978 | 406 | 13 | 15 | 1347 |
| 1979 | 405 | 15 | 22 | 1306 |
| 1980 | 387 | 23 | 19 | 1368 |
| 1981 | 415 | 29 | 14 | 1342 |
| 1982 | 496 | 25 | 23 | 1344 |
| 1983 | 564 | 21 | 27 | 1421 |
| 1984 | 538 | 17 | 36 | 1453 |
| 1985 | 493 | 13 | 44 | 1554 |
| 1986 | 432 | 16 | 46 | 1508 |
| 1987 | 433 | 18 | 47 | 1525 |
| 1988 | 461 | 17 | 62 | 1573 |
| 1989 | 491 | 22 | 77 | 1618 |
| 1990 | 499 | 14 | 77 | 1789 |
| 1991 | 533 | 41 | 83 | 1891 |
| 1992 | 547 | 33 | 71 | 1826 |
| 1993 | 532 | 53 | 74 | 1991 |
| 1994 | 532 | 62 | 79 | 1997 |
| 1995 | 521 | 55 | 78 | 1951 |
| 1996 | 584 | 30 | 84 | 1904 |
| 1997 | 593 | 42 | 77 | 1824 |
| 1998 | 588 | 36 | 75 | 1767 |
| 1999 | 624 | 43 | 58 | 1787 |
| 2000 | 594 | 44 | 52 | 1859 |
| 2001 | 612 | 47 | 61 | 2041 |
| 2002 | 666 | 52 | 64 | 2050 |
| 2003 | 644 | 38 | 69 | 2194 |
| 2004 | 618 | 47 | 72 | 2290 |
| 2005 | 585 | 109 | 76 | 2354 |
| 2006 | 572 | 85 | 75 | 2519 |
| 2007 | 664 | 84 | 78 | 2594 |
| 2008 | 731 | 112 | 76 | 2469 |
| 2009 | 803 | 106 | 71 | 2423 |
| 2010 | 993 | 77 | 71 | 2484 |
| 2011 | 935 | 74 | 79 | 2639 |
| 2012 | 947 | 75 | 83 | 2578 |
| 2013 | 1030 | 68 | 85 | 2551 |
| 2014 | 1051 | 85 | 88 | 2581 |
| 2015 | 1003 | 79 | 93 | 2688 |
| 2016 | 1005 | 100 | 89 | 2774 |
More sentences also served with an ankle monitor
As illustrated in figure 2 and the statistics from previous years, there has been a large increase in the number of persons serving either the whole or part of a sentence using electronic monitoring (EM) with an ankle monitor. The 3 113 discharges from EM in 2016 were almost 5 per cent more than the previous year and as much as 26 per cent more than in 2014.
Figure 2. Discharges, by type of imprisonment. Absolute figures
| 2001 | 2002 | 2003 | 2004 | 2005 | 2006 | 2007 | 2008 | 2009 | 2010 | 2011 | 2012 | 2013 | 2014 | 2015 | 2016 | |
| Servingsentencefor non-payment of afine | 900 | 1072 | 654 | 679 | 1605 | 1287 | 1241 | 1601 | 1435 | 1082 | 970 | 1002 | 822 | 916 | 881 | 1049 |
| Custody | 2694 | 2724 | 2339 | 2007 | 1984 | 1972 | 1888 | 1881 | 2205 | 2409 | 2203 | 2184 | 2146 | 1909 | 1824 | 1692 |
| Electronic monitoring | 0 | 70 | 689 | 917 | 960 | 1385 | 1727 | 2479 | 2967 | 3113 | ||||||
| Prison sentence and preventive detention/ security detention | 8072 | 7699 | 7847 | 8151 | 8413 | 8966 | 9644 | 9147 | 7861 | 7727 | 7208 | 6972 | 6632 | 5756 | 5823 | 6257 |
More served shorter sentences, especially for driving under the influence
There was a total of 9 357 discharges from sentences in 2016. Of these, 5 667 were completed sentences of less than two months, which is almost 8 per cent more than in the previous year. Among these, the largest increase was for those who had served a sentence for driving under the influence, and this was the principal offence in 2 104 of these sentences. This is an increase of more than 25 per cent compared to the four preceding years, and much of the increase was in sentences served in prison facilities.
More short sentences were served in prison, after eight years with a major decline
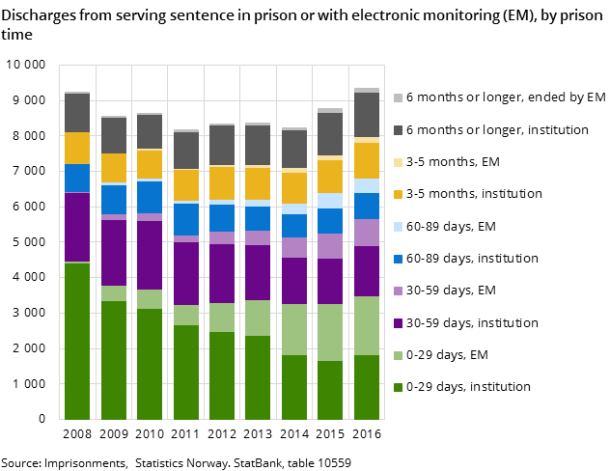
The number of discharges from prison institutions after serving less than two months has been decreasing every year, and was more than halved overall in the period 2007–2015. In 2016, however, 9 per cent more of such short sentences were served in prison institutions, as illustrated in figure 3. This was mainly due to a 41 per cent increase in sentences served for driving under the influence.
Home detention with an ankle monitor (EM) is a major contributor to the growing number of shorter sentences in particular being served outside prison facilities. The increase in shorter prison sentences in 2016 therefore represents a clear break in one of the most significant trends in the Norwegian Correctional Services in recent years. In the statistics on imprisonment, this break is shown in different ways, partly through the relatively large increase in female prisoners.
Some features of the development must thus be seen in light of the developments in the statistics on those charged and sanctioned for the various types of offences. However, the considerable changes in relation to prison institutions must be viewed in conjunction with the high number of prison places available at the end of 2015 and throughout 2016 – especially due to the transfer of prisoners to Norgerhaven in the Netherlands.
More persons sentenced for more serious offences
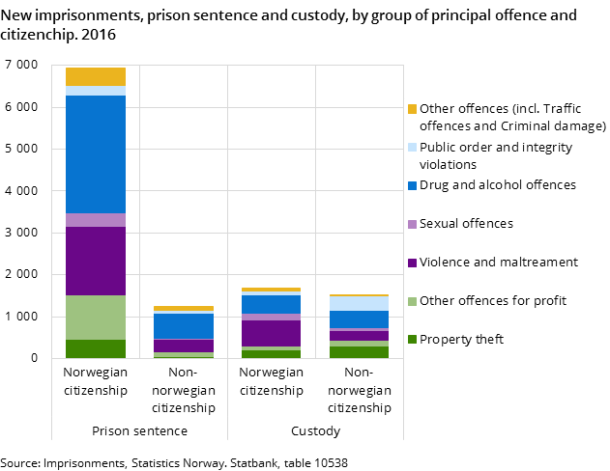
The increase in prisoner numbers was not solely due to the rise in short sentences. For instance, there were 1 660 new imprisonments in prison institutions for violence and maltreatment in 2016, which is almost 8 per cent more than the year before. In this group of principal offences, there was an increase in sentences for both grievous bodily harm and maltreatment in close relations.
Fewer, but longer stays in custody
On an average day in 2016, 1 005 persons were being held in custody. This is the same high level as in the previous six years, as illustrated in figure 1. A total of 3 189 stays in custody were finished in 2016, which is 7 per cent fewer than in 2015 and as much as 21 per cent fewer than in 2013. The decline in both periods is thus approximately equal among those who are released directly from custody and those who are held in custody until they are transferred to serve the remainder of their sentence of uconditional imprisonment.
Norwegian citizens now in the majority
In the period 2013–2016, there was a particularly large decline in the number remanded in custody for theft and narcotic offences. Compared to earlier years, there were also significantly fewer remanded in custody for violations of immigration legislation. Overall, the decline among foreign citizens is the largest contributor to the fall in the number of stays in custody in recent years. Thus, for the first time in the five-year period for which we have such statistics, the number of stays in custody was higher for Norwegians than for non-Norwegians in 2016, as illustrated in figure 4.
Contact
-
Kristin Bergvall
-
Reid Jone Stene
-
Statistics Norway's Information Centre


