Content
Published:
This is an archived release.
Smaller share are victims of violence and theft
In 2015, 9.8 per cent of the population reported that they had been the victim of one or more incidents of theft, damage to property, violence or threats of violence. This share of victims, both in total and for each type of crime, is smaller than in all previous surveys.
| 2001 | 2004 | 2007 | 2012 | 2015 | |
|---|---|---|---|---|---|
| 1Figures for 2012 and 2015 corrected 24 June 2016 | |||||
| Exposed to violence or threats of violence last 12 months, total | 5.0 | 5.1 | 5.5 | 4.3 | 3.5 |
| Exposed to theft or criminal damage last 12 months | 10.0 | 11.8 | 10.1 | 8.0 | 7.0 |
| Feared violence or threats in their home area recently | 7.9 | 7.9 | 6.7 | 7.3 | 5.6 |
| Feared thefts or criminal damage recently | 14.2 | 14.3 | 10.5 | 10.3 | 9.4 |
| Number of respondents | 3 250 | 3 340 | 3 212 | 6 186 | 6 393 |
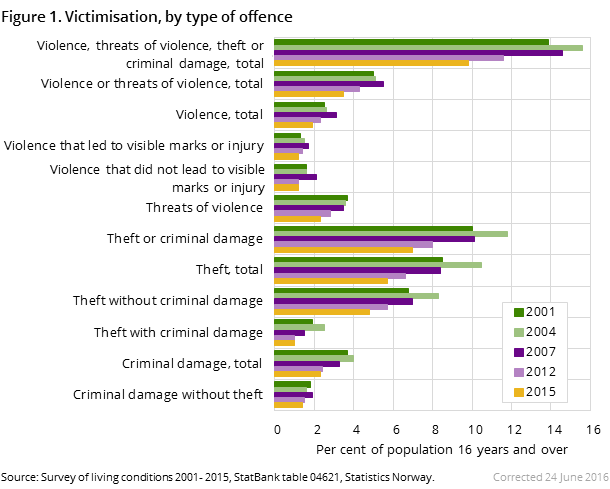
The survey on living conditions carried out in 2015 shows that 9.8 per cent of the population aged 16 years or older were the victim of one or more incidents of violence, threats, theft or damage to property. This corresponds to about 400 000 of the adult population being subjected to these types of offences at least once during the course of a year.
However, this is a significantly smaller share than the corresponding share of 11.6 per cent in 2012, and the 14-16 per cent share reported in the period 2001-2007. Going even further back in time – to 1991 and 1997 – the victim rate among the adult population for these types of offences was as much as 17 per cent.
General decrease in victims for all types of offences
For nearly all types of offences mapped in the 2012 and 2015 surveys saw a decrease. The biggest decrease was among those who were victims of theft; however violence and threats combined almost saw the same reduction as theft, as shown in figure 1.
Theft victims in the population nearly halved
From the surveys carried out in the 1990s and up to 2004, about 10 per cent of the adult population reported having been victims of theft in the course of a year. However, this share has decreased in the last three surveys, and was almost halved to 5.7 per cent in 2015.
In the period 2004-2015, the biggest decrease is among those under 45 years of age, and the fall was roughly equal for men and women. For example, in 2004, over 17 per cent of those aged 16-24 years reported having been a victim of theft during the previous year. The corresponding share for men and women in this age group in 2015 was 7.3 per cent.
Differences remain between urban and rural populations
In each of the last three surveys, there has been a gradual decrease in victims of theft in all areas of residence. Relative to the 2004 level, the scope of theft victims in 2015 is about halved for the four types of residential areas included in the surveys. In the most sparsely populated areas, fewer than 3 per cent of the population reported having been a victim of theft in 2015. The corresponding share was about 8.5 per cent among those living in areas with a population of 100 000 or more.
Thus, the decrease from recent years has not altered the findings of previous surveys and statistics on offences reported to the police: there is a clear connection between the scope of theft and the population density of an area. The majority of thefts and other types of offences for profit happen in the biggest cities and most densely populated areas, thus making the population in such areas most at risk for these types of offences.
Share of thefts reported to the police remains stable
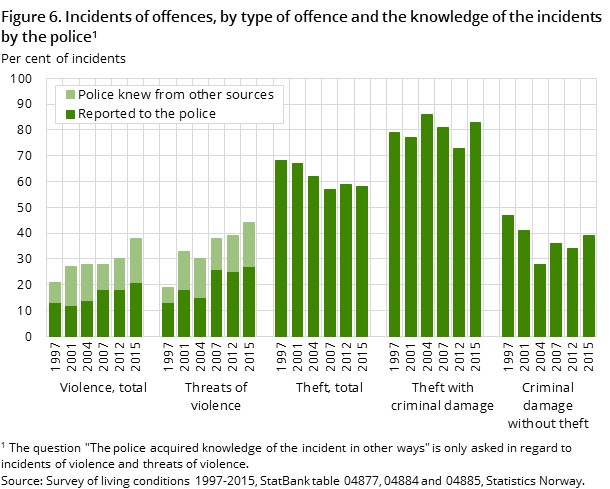
In Norway, victims (persons) report far more incidents of theft than violence to police. In 2015, 58 per cent of all victims of theft reported the offence to the police, which is about the same share as in 2012 and in 2007.
The value of stolen or damaged goods has a large impact on whether or not an offence is reported to the police. Of all thefts with criminal damage, for the most part targeted at cars or dwellings, 83 per cent were reported to the police in 2015. However, thefts of this type that are frequently reported to the police only make up about 15 per cent of all thefts in recent surveys, as opposed to 30-40 per cent in the 1990s. The changes in the inclination to report theft to the police, as shown in figure 6, is first and foremost connected to changes in the types of theft to which the population is subjected.
Lowest share of victims of violence ever mapped
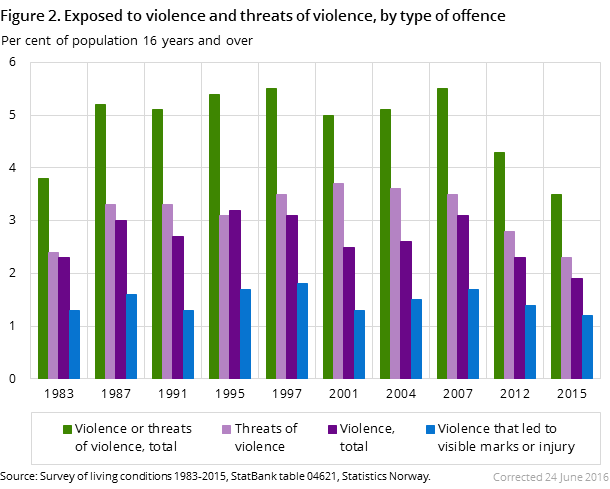
In the 2015 survey, 3.5 per cent of the population aged 16 years or older reported having been the victim of violence or threats of violence at least once in the course of the preceding year. This share is smaller than the 4.3 per cent share in 2012, and represents a significant decrease from the surveys from 1987-2007, when the corresponding shares ranged between 5.0 and 5.5 per cent.
Furthermore, for the first time, the 2015 share is smaller than the first survey on living conditions in 1983, when 3.8 per cent of the population reported having been the victim of violence or threats of violence in the preceding year. In 2015, the share of victims of the grouped types of violence threats are smaller than in all previous years – as shown in figure 2.
A similar development is also notable from the previous years’ statistics on victims of offences reported to the police, where there has been a significant decrease in the share of victims in the adult population. This is mainly due to a decrease in the reported violence among young adults – especially for men and in the wake of a long period of a relatively stable level of violence in the population.
Decrease for young adult victims of violence
All previous surveys have shown that young adults aged 16-24 years have been much more frequent victims of violence than older age groups, which is significant both for men and women. However, the overall decrease in victims of violence from the last two surveys can be attributed to this particular age group. Among men and women in this age group, the share of victims of violence in 2015 is half of that reported in the 2007 survey.
The share of victims of threats in the age group 16-24 years was also subject to a decrease during 2007-2015, although a somewhat smaller decrease than for violence. There was also a decrease in victims of threats in the older age groups.
Youths as violent offenders dropped
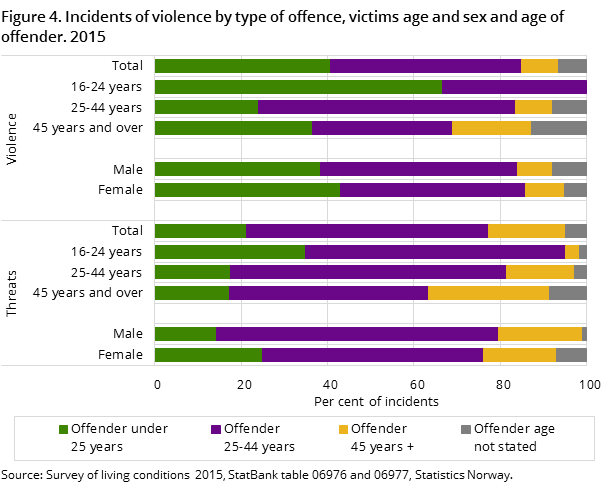
When taking the offender’s age into account for the period 2007-2015, there are clear indications that the general decrease in violence is due to a drop in youth-on-youth violence. In 2015, an offender under 25 years of age was reported in 23 per cent of all incidents of violence, of which 35 per cent of the victims were from the same age group as the perpetrator – as shown in figure 4. However, in the previous two surveys, the youngest offenders were responsible for over 40 per cent of all incidents of violence, and for more than 60 per cent of all violence against victims aged 16-24 years.
Thus, the level of violence from the 2015 survey is to a greater extent dominated by violence with offenders aged over 25 years. This also means that the share of violence and threats committed by offenders aged over 45 years is greater than in the previous two surveys. A similar development is also registered among offenders reported to the police and charged with violent offences.
Women more often victims of threats of violence
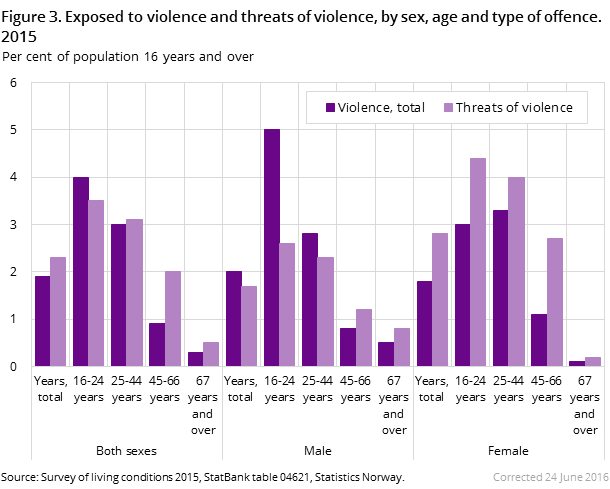
Victimisation patterns for violence and threats are unequally distributed among different ages and sex. As clearly illustrated in figure 3, a far greater share of women than men report having been exposed to threats of violence. This also influences the overall distribution of violence and threats of violence among women and men, with a victimisation share of 3.9 and 3.2 per cent respectively.
Nearly equal share of victims of violence among men and women
Inasmuch as the decrease in victims of violence has been greater for men than women, the 2015 survey shows a nearly equal share of victims of violence among the sexes. In 2015, 1.8 per cent of all women and 2.0 per cent of all men reported having been a victim of violence at least once during the preceding year. The biggest shares are found among men aged 16-24 years, where the corresponding victimisation share was 5.0 per cent. Among female victims of violence in 2015, the share of victims was biggest in the age group 25-44 years, with 3.32 per cent.
Young men still more frequently injured as a result of violence
In the 2015 survey on living conditions, 1.2 per cent of the adult population reported having been a victim of violence leaving visible marks or injuries at least once over the course of 12 months. The share of victims of violence leading to injuries has been far more significant for young men, while the youngest women have been more often exposed to threats of violence. Such differences between the sexes and different age groups are still significant in the 2015 survey, although less predominant than in previous surveys – as shown in figure 3.
Grown up women exposed to repeated violence
Victims of violence or threats of violence are relatively often exposed more than once during a year. In the last survey, such victims reported an average of 1.9 incidents of violence or threats of violence.
Repeated victimisation is more common among women than men. Among the victims of violence in 2015, women were on average exposed to 2.2 incidents of violence during a year, while the corresponding share for men was 1.6 incidents. Women aged 25-44 years are particularly exposed to repeated violence or threats of violence, and women in this group on average were the victim of 3 violent incidents during the preceding 12 months.
Violence in public, private residences, within families and at work
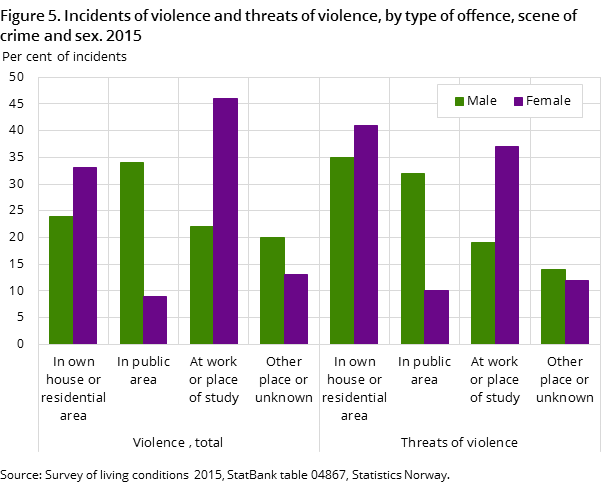
The survey on living conditions maps types of violence and threats from different circumstances and times of day – and in situations between persons with various types of relationships. Since there has been a decrease in previous years of both the number of victims and incidents of violence – especially among the youngest – the distribution of violence has also changed. In the previous two surveys, about half of all incidents of violence against women happened at work or place of study, while one third took place in private residents or areas – as shown in figure 5. In most surveys dating further back, such incidences of violence against women were predominantly in private residences, and one third were reported as taking place at work.
The fact that women are more exposed to violence at work is also one of the findings of the survey on living conditions, working environment. The significant influence of different family situations on both sexes is mapped in a separate analysis of the surveys of living conditions 1997-2004 (in Norwegian only). This analysis found that the share of victims of violence was higher for singles in all age groups than among similarly aged persons in other family situations. In 2015, a corresponding connection is visible, but the share of victims among single persons is far smaller than before. However, single parents do not seem to have had a decrease, thus making this group stand out even more than previously as particularly exposed to violence.
Men and women still victims of different types of violence
Despite the changes in recent surveys, there are still some significant differences between men and women in what types of violence they are exposed to. As in most previous surveys, the 2015 survey states that men are more often the victim of violence in public places, at night, at the weekend and by an intoxicated offender. Furthermore, violence against men is more often committed by an unknown offender. A far greater share of all incidents of violence against women happen at work or in private residences, and by an offender who is not intoxicated.
Most offenders are men
Men are the offender in more than 80 per cent of all incidents of violence or threats of violence. This share is equal to the results from the previous two surveys. Men are offenders in a greater share of threats of violence than of physical incidents of violence. However, in the last three surveys, women have been the offender in more than one fifth of all incidents of violence against women. Women of working age are especially exposed to violence by another woman.
Far more women experience fear of violence in their home areas
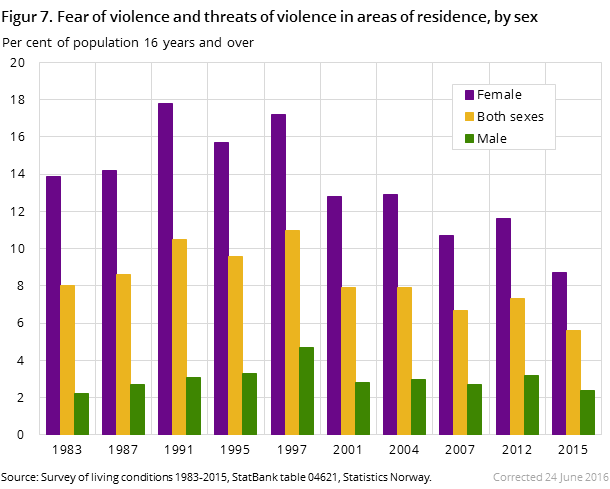
In all surveys of living conditions – also in 2015 – far more women than men report experiencing fear of violence or threats of violence in their home areas. During the last period prior to the 2015 survey, 8.7 per cent of all women had experienced situations in their home areas provoking fear of violence or threats. This constitutes a further decline in the female fear of violence, as shown in surveys prior to the 2012 survey and as shown in figure 7.
In 2015, nearly16 per cent of all women aged 16-24 years had recently experienced fear of being a victim of violence or threats. Among men in the same age group, only 2 per cent reported such fears. As opposed to previous surveys, especially from before 2000, the 2012 and 2015 surveys also marked a relatively clear connection between age and fear of violence and threats – now most predominantly among women. The younger a person is, the higher the share that experience a situation in their home area that provokes fear of violence and threats. Despite the fact there are still large disparities between men and women, there is now an even clearer connection between fearing violence and being the victim of violence.
Further decline in fear of theft and damage to property
In the six surveys conducted in the period 1997-2015, the population is asked if they recently have experienced fear of being a victim of theft or damage to property. Over the course of these years, the share who reported having experienced such fears has more than halved. In 2015, just over 9 per cent reported having experienced fear of theft or damage to property. The corresponding share from the 2007 and 2012 surveys was over 10 per cent. From 2012 to 2015, such fears were predominant among women and those in the youngest age groups. Overall, the shares reporting having experienced fear of theft or damage to property have fallen.
The surveys on living conditions, victimisation and fear of crime, 1983-2015Open and readClose
Over a period of 33 years, the population has been asked about their victimisation and fear of violence and threats in ten surveys. Seven of these surveys include up to six types of violence and threats, as well as type of scene of crime, time of day and contact with the police and health personnel. These questionnaires have also asked about the victim´s relation to the offender and whether or not the offender was intoxicated. In the last three surveys, the sex and age of the offender is also mapped. In the last six surveys, and in 1991, the questionnaires contained questions on victimisation of theft and damage to property, including questions on type of scene of crime, time of year, value of stolen or damaged items and whether or not the offence was reported to the police. In the last six surveys, the respondents have also been asked about their fear of being victims of theft and damage to property. All figures available in StatBank.
Survey on living condition EU-SILC 2015Open and readClose
The survey on living condition 2015 is an interview survey of a representative sample of the Norwegian population aged 16 years and over. The survey is conducted as phone interviews. Of the 11 518 included in the 2015 sample, 6 393 responded to the questionnaire. This is a response rate of 55.5 per cent, and is about level with the shares and figures from the 2012 survey. The answers from the questionnaire are combined with certain registry information. Read more about definitions in About the statistics, and see further information on content and conducting the 2015 survey in the Documentation note (in Norwegian only).
Some figures have been corrected due to a change in non-response weights 24 June 2016Open and readClose
To ensure that the statistics is representative, a non-response weight is used, see About the statistics and Documentation report (only available in Norwegian). In the first publication of this statistics, the weights did not adequately adjust for the variable education. The article, and the figures in the four relevant tables in the StatBank, are now adjusted according to this. The total share of the adult population who were exposed to theft, criminal damage, violence or threats of violence were, for instance, corrected from 9.6 to 9.8 per cent. The statistics for the year 2012 is also corrected, but to an even smaller degree. Similar changes are made for the statistics on Housing conditions, that has the same data source.
Find more figures
Find detailed figures from Victimisation and fear of crime, survey on living conditions
Additional information
Read more about the execution of the last survey in the documentation note (Norwegian only):
Contact
-
Reid Jone Stene
E-mail: reid.jone.stene@ssb.no
tel.: (+47) 99 02 22 01
