Record low reported offences in 2017
Publisert:
The police and prosecution authority registered 318 600 offences in 2017. This is the lowest number in the 25-year history of the statistics. However, there were more reports of sexual abuse against children.
- Full set of figures
- Offences and victims reported to the police
- Series archive
- Offences and victims reported to the police (archive)
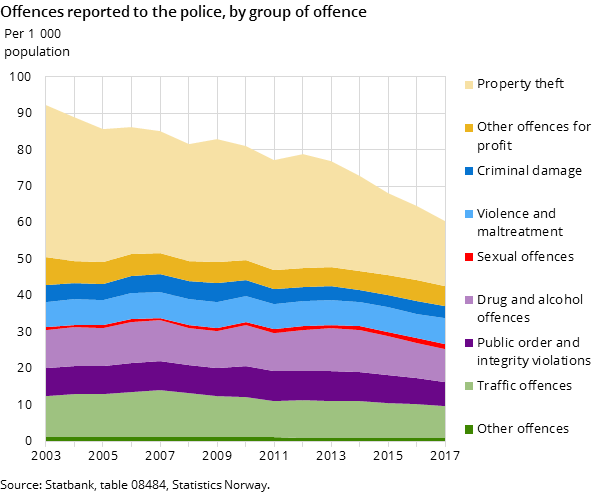
The decline in the number of violations reported annually in the last decade is characterised by the sharp reduction in property thefts, as shown in Figure 1. A similar development is also seen in victimisation surveys.
In the last four years there has also been a marked decline in registered drug offences. The low number of violations reported in 2017 also correlates with last year's 7 per cent decline in other offences for profit and traffic offences, as well as almost 4 per cent fewer public order and integrity violations. However, there were more reported cases of violence and maltreatment and sexual offences in 2017 than the year before.
Fewer thefts, especially from people in public places
In 2017, 94 900 property thefts were reported, which is almost ten per cent less than the year before and half of the level around the turn of the millennium. According to Statistics Norway’s classification of offences, 12 000 of the thefts in 2017 are classified as minor theft and 10 000 as gross theft.
Following the introduction of the new Penal Code in 2015, there are several breaks in the time series for the crime statistics, especially for several specified types of theft. Nevertheless, the figures tell us that from 2016 to 2017 there was an actual decrease for several of the main types of theft.
With this in mind, the decline still appears greatest for theft from the person. In 2017, a total of 27 000 thefts from a person in different public places were recorded, including aggravated cases, which is 13 per cent less than in 2016. The decline in theft related to motor vehicles continued in 2017, and the 13 200 reported incidents of such thefts are 9 per cent less than in previous years and 78 per cent less than in 2002.
Figure 2. Thefts reported, by type of thefts. Per 1 000 population
| 2003 | 2004 | 2005 | 2006 | 2007 | 2008 | 2009 | 2010 | 2011 | 2012 | 2013 | 2014 | 2015 | 2016 | 2017 | |
| Theft from the person (incl. aggravated) and Other or unspecified theft (incl. petty and aggravated) | 10.06754459 | 10.72713518 | 9.893054455 | 9.955133583 | 10.33467532 | 10.09885436 | 10.31994152 | 9.984564239 | 11.0383401 | 12.61424786 | 11.62261013 | 9.383925328 | 8.317972698 | 6.609531865 | 5.453075575 |
| Theft from shops and other enterprises (incl. petty and aggravated) | 10.44779595 | 9.753013518 | 9.199665767 | 8.021173139 | 7.438795813 | 7.184878908 | 7.961448992 | 7.508955479 | 6.759133834 | 6.574579762 | 6.057084597 | 5.626479725 | 4.424675975 | 4.925407342 | 4.739158936 |
| Theft from dwelling and holiday home (incl. aggravated) | 5.453784193 | 4.914519131 | 4.628380351 | 4.430825355 | 4.07614907 | 4.268581396 | 4.607801382 | 4.102343276 | 3.60790642 | 3.622437007 | 3.483278974 | 3.290236004 | 2.925779966 | 2.842931079 | 2.608058814 |
| Theft from car and other motor vehicle (incl. aggravated) and Theft of car and other motor vehicle | 11.80272973 | 10.7367475 | 9.36356948 | 9.063149821 | 8.316147327 | 7.514189376 | 7.313222977 | 6.490059382 | 5.712857231 | 5.26909045 | 4.462635671 | 3.952002092 | 3.350689786 | 2.784242762 | 2.516014154 |
| Bicycle theft | 3.825798748 | 3.305984087 | 3.216420417 | 3.196831874 | 2.90869691 | 2.746364866 | 3.149240757 | 3.043720523 | 2.987213191 | 3.080706075 | 3.266106082 | 3.587355472 | 3.209375814 | 2.881481247 | 2.594176045 |
Decline in control-based reports
The number of reported drug and alcohol offences as well as traffic offences is significantly affected by control and patrol operations. Compared to 2016, the first year following the police district reform, there was a 6.7 per cent decline for both these main groups.
In total, 46 900 drug and alcohol offences were reported in 2017, broken down into 33 600 narcotic offences, 1 600 doping offences, 9 600 cases of driving under the influence and 550 alcohol offences. There was a certain decline for all types of drug and alcohol offences, but this was clearly greatest for use and minor possession of narcotics. These alone accounted for two thirds of the total reduction in the 3 400 drug and alcohol offences compared to the previous year.
Reported drug and alcohol offences have had a downward trend in recent years, and from 2013 the decline is 21 per cent. There are also significantly fewer reported disturbances. Among other types, the 2 390 reported cases of breach of the peace under self-induced intoxication are 18 per cent less than the year before, and 42 per cent lower than in 2013.
More reported sex offences against children
There were 7 990 sexual offences reported in 2017, which is 13 per cent more than the year before and a 67 per cent increase compared to 2014.
During the previous two years, there was an increase in both registered incidents and victims for most types of sexual offences. The increase in reported incidents in 2017 is instead primarily a result of the police registering far more sexual offences related to depictions of children and young people under 18 years old. This type of offence is grouped in the statistics under ‘Other or unspecified sexual abuse’, where there were 820 more incidents in 2017 than in the previous year.
There was also a marked increase in reported cases of sexual intercourse with children under 14 years, which in the new Penal Code is classified as rape. In 2017, 790 such rapes (including aggravated) were recorded, which is 17 per cent more than the year before. In 56 per cent of the reports, the rape had taken place more than a year before the incident was registered by police, and it is mainly these older offences that have increased in the reports over the last couple of years.
More violence and maltreatment than in the previous three years
The 36 700 reported cases of violence and abuse in 2017 are 4.9 per cent more than in 2016. Even when we take into account the population increase, the volume is somewhat higher than in the previous three years. The total extent of reported cases of violence and maltreatment is thus back at the same level as in the ten-year period 2004-2013, see figure 3.
Figure 3. Violence and maltreatment reported to the police, by type of offence. Per 1 000 population
| Assault, total | Bodily harm, total | Maltreatment in close relations, total | Assault of public servant | Threats, total | Reckless behaviour and stalking | Other types of violence and maltreatment | |
| 2003 | 2.49854 | 0.61596 | 0.00000 | 0.19002 | 1.91751 | 1.07793 | 0.55906 |
| 2004 | 2.65540 | 0.63004 | 0.00000 | 0.20230 | 1.85146 | 1.05779 | 0.59094 |
| 2005 | 2.71234 | 0.64281 | 0.00000 | 0.20016 | 1.78362 | 0.93067 | 0.56834 |
| 2006 | 2.75741 | 0.68639 | 0.10129 | 0.21055 | 1.67492 | 0.97215 | 0.56635 |
| 2007 | 2.68631 | 0.70752 | 0.19995 | 0.21811 | 1.60709 | 0.99613 | 0.58682 |
| 2008 | 2.58741 | 0.69219 | 0.30778 | 0.24677 | 1.62333 | 0.99236 | 0.62463 |
| 2009 | 2.41579 | 0.64448 | 0.44153 | 0.26817 | 1.61108 | 1.03370 | 0.65698 |
| 2010 | 2.34675 | 0.60207 | 0.50368 | 0.27315 | 1.60121 | 1.08579 | 0.63007 |
| 2011 | 2.38705 | 0.57659 | 0.52334 | 0.28819 | 1.53608 | 1.02494 | 0.59407 |
| 2012 | 2.42225 | 0.55778 | 0.51265 | 0.32412 | 1.63201 | 0.96533 | 0.54033 |
| 2013 | 2.32793 | 0.50799 | 0.55946 | 0.32962 | 1.64236 | 1.01182 | 0.57886 |
| 2014 | 2.22115 | 0.46525 | 0.59815 | 0.32804 | 1.54745 | 1.06654 | 0.44999 |
| 2015 | 2.27244 | 0.43343 | 0.64308 | 0.34941 | 1.61311 | 1.04534 | 0.41910 |
| 2016 | 2.36057 | 0.42175 | 0.65919 | 0.30898 | 1.65075 | 0.89356 | 0.41197 |
| 2017 | 2.39126 | 0.40165 | 0.70764 | 0.30010 | 1.70891 | 1.06308 | 0.40431 |
More reports of threatening behaviour and assaults
Compared with the year before, the largest increase in violent offences was amongst non-physical offences, i.e. threats and other reckless behaviour and stalking. In total, 14 600 such offences were reported in 2017, which is 9.9 per cent more than the year before.
Of physical offences of violence, 12 600 assaults were reported, which is 2.2 per cent more than in 2016. However, the 2 100 cases of the more serious type of physical violence, bodily harm, is less than in previous years.
More reported abuse in close relationships
The police registered 3 700 cases of maltreatment in close relations during 2017, which is 8 per cent more than in 2016. Following the legislative changes and the first registrations of this type of violent crime in 2006, the number of such reports has increased significantly, as illustrated in Figure 3. In particular, the statistics on victims have shown that this trend has occurred both due to changes in legislation, new registration practices and increased reporting of this type of abuse to the police. In 2017, three out of four reported situations of maltreatment had taken place up to one month before the report, and it was mainly the increase in cases that had taken place recently that pushed up the number of reported cases of maltreatment in close relationships in total compared to 2016.
Biggest increase in Akershus
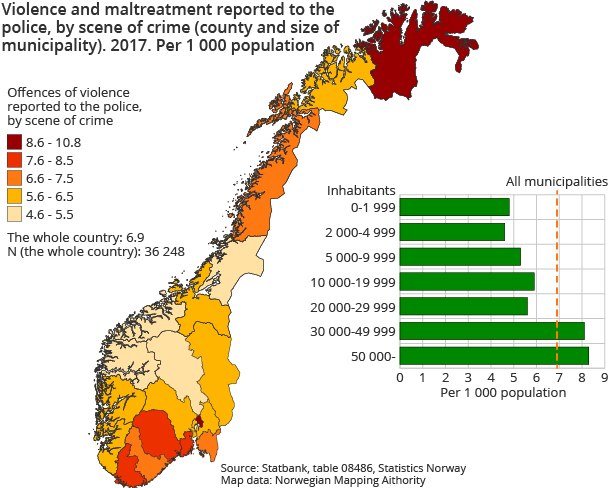
As shown in Figure 4, Oslo and Finnmark have the highest levels of reported violent crime, with 10.8 and 9.7 cases per 1 000 inhabitants respectively in 2017. For both these counties, this is on a par with the previous year and somewhat lower than in the period 2010-2013.
Compared with the previous year, Akershus is the county with the largest increase in reported violence and maltreatment. The 3 500 registered cases in 2017 are 20 per cent more than the previous year. The increases in both Nord- and Sør-Trønderlag are also considerably larger than in the other counties, and the changes in these three counties are, in total, equivalent to more than half of the increase in registered violence throughout the country. However, the level of reported violence and maltreatment is still lower in Akershus and Trøndelag than in the rest of Norway.
Kontakt
-
Reid Jone Stene
-
Siri Fjærtoft Fossanger
-
Sigmund Book Mohn
-
SSBs informasjonstjeneste


