Content
Published:
This is an archived release.
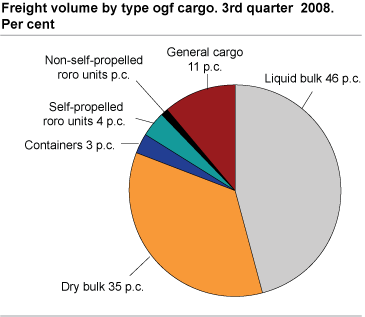
Decrease in transport of liquid bulk
A total of 43.0 million tonnes of goods were transported between the largest ports in the 3rd quarter of 2008; 3.2 million tonnes, or 7.1 per cent less than the 3rd quarter of 2007.
A total of 19.7 million tonnes of liquid bulk were transported in the 3rd quarter of 2008. For the same period in 2007, the amount of liquid bulk was 23.9 million tonnes; a decrease of 4.3 million tonnes, or 17.8 per cent. Ninety-one per cent of the reduction took place in Bergen port. Tankers made 2 600 port calls in the 3r d quarter of 2008; 250 more than the 3rd quarter of 2007.
Slight increase in dry bulk
In the 3r d quarter of 2008, dry bulk transport totalled 15.2 million tonnes; an increase of 1.4 per cent compared to the same period in 2007. Dry bulk was the second largest cargo type. Narvik is the largest port for dry bulk in Norway, with 4 million tonnes in the 3rd quarter of 2008.
International ferries relatively stable
From July to September, 2.2 million passengers travelled with international ferries to and from Norway. This figure was almost the same as for the 3rd quarter of 2007. International passenger traffic to Grenland, Sandefjord and Larvik increased, while traffic to Bergen and Oslo fell. In total, international ferries made 1 900 port calls during the 3rd quarter of 2008.
Fewer containers carrying more goods
A total of 151 000 TEU-containers (twenty foot equivalent unit) were handled by the largest Norwegian ports in the 3rd quarter of 2008, of which 107 000 carried cargo. The overall reduction in the number of TEU-containers between the 2nd quarters of 2007 and 2008 was 6 300; a 4 per cent decrease. The largest container port was Oslo, with 46 000 TEU-containers. The total goods in containers increased by 5.2 per cent from the 3rd quarter of 2007 to 1.2 million tonnes in the 3rd quarter of 2008.
Fewer passengers on the Coastal Express Liner
In the 3rd quarter of 2008, 167 600 passengers travelled with the Coastal Express Liner; 3 600, or 2.1 per cent less than the same period in 2007. July and August saw a decrease in traffic, while September had an increase.
Tables:
- Table 1 Maritime transport statistics. Cargo in domestic and international traffic, by port district. 3rd quarter 2008. Tonnes
- Table 2 Maritime transport statistics. Cargo by port district. 3rd quarter 2008. Tonnes
- Table 3 Maritime transport statistics. Number of containers TEU (by lolo and roro) and cargo, by port district. 3rd quarter 2008. Tonnes
- Table 4 Maritime transport statistics. Number of passengers and vehicles in ferry transport, by port district. 3rd quarter 2008
- Table 5 Maritime transport statistics. Arrivals of vessels, by type of vessel. 3rd quarter 2008
- Table 6 Express Coastal Liner Bergen-Kirkenes, 3rd quarter 2008. The number of passengers
Contact
-
Liv Torunn Petersen
E-mail: liv.torunn.petersen@ssb.no
tel.: (+47) 40 81 13 82
-
Sjøtransport
E-mail: sjotransport@ssb.no
-
Henrik Eli Almaas
E-mail: henrik.almaas@ssb.no
tel.: (+47) 97 78 89 27

