Content
Published:
This is an archived release.
Fewer passengers with international ferries
A total of 220 000, or 10 per cent, fewer passenger travelled with international ferries in the 3r d quarter of 2009 compared with the 3r d quarter of 2008. Fewer buses, cars and motorcycles were also transported.
A total of 2 million passengers travelled with international ferries from Norwegian ports in the3r d quarter of 2009. Kristiansand and Oslo port had the most travellers. In Kristiansand, port traffic went down by 78 000 (13.4 per cent) compared to the same quarter in 2008. Oslo port had an increase of 30 000 passengers, or 4.0 per cent, over the same period.
Total transport of goods down in the largest Norwegian ports
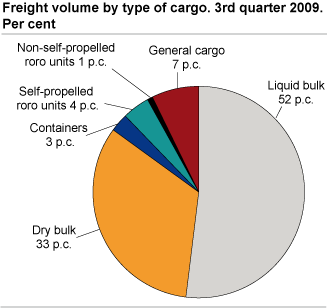
A total of 40.6 million tonnes of goods were transported in the largest ports in the 3r d quarter of 2009. This was 3.1 million tonnes, or 7.1 per cent, less compared to the same period in 2008. Transport of liquid bulk had an increase of 0.7 million tonnes, or 3.4 per cent, from the 3r d quarter of 2008 to the 3r d quarter of 2009. Bergen and Omland Port Authority was the largest liquid bulk port and had an increase of 1.3 million tonnes, or 10.5 per cent, in the same period. International goods transport represented 65 per cent of the total transport volume in the 3rd quarter of 2009.
Less transport of dry bulk
A total of 13.4 million tonnes of dry bulk were transported in the 3r d quarter of 2009. This was 1.9 million tonnes, or 12.2 per cent, less than the3r d quarter of 2008. Narvik port had, with 3.9 million tonnes, 29 per cent of all the dry bulk transported in the3r d quarter of 2009. This is a reduction of 5.4 per cent compared to the same period in 2008.
Fewer port calls
There were 2 000 fewer port calls in Norwegian ports during the 3r d quarter of 2009, compared to the 3r d quarter of 2008. Port calls by ferries in international traffic fell 700 from the same quarter of 2009.
Less traffic with the Coastal Express Liner
A total of 152 000 passengers travelled with the Coastal Express Liner in the 3rd quarter 2009. This was a decrease of 16 000 passengers, or 9.5 per cent, compared with the 3r d quarter of 2008. All months in the quarter showed less traffic than the months of the same quarter in 2008.
Liquid bulk and dry bulkLiquid bulk includes oil and other liquid products. Dry bulk includes grains/cereals, coal, iron ore and other non liquid products |
TEU containerTwenty-foot Equivalent Unit container |
Tables:
- Table 1 Maritime transport statistics. Cargo in domestic and international traffic, by port district. 3rd quarter 2009. Tonnes
- Table 2 Maritime transport statistics. Cargo by port district. 3rd quarter 2009. Tonnes
- Table 3 Maritime transport statistics. Number of containers TEU (by lolo and roro) and cargo, by port district. 3rd quarter 2009. Tonnes
- Table 4 Maritime transport statistics. Number of passengers and vehicles in ferry transport, by port district. 3rd quarter 2009
- Table 5 Maritime transport statistics. Arrivals of vessels, by type of vessel. 3rd quarter 2009
- Table 6 Express Coastal Liner Bergen-Kirkenes, 3rd quarter 2009. The number of passengers
Contact
-
Liv Torunn Petersen
E-mail: liv.torunn.petersen@ssb.no
tel.: (+47) 40 81 13 82
-
Sjøtransport
E-mail: sjotransport@ssb.no
-
Henrik Eli Almaas
E-mail: henrik.almaas@ssb.no
tel.: (+47) 97 78 89 27

