Content
Published:
This is an archived release.
Increased container traffic
There was an increase of 3.9 million tonnes to and from the largest ports of Norway during the 2n d quarter of 2010, or 10.2 per cent, compared to the 2n d quarter of 2009. The transport of dry bulk had an increase of 33.6 per cent in the same period.
Hammerfest port
From the 1s t quarter of 2010, Hammerfest port is included in the port statistics. Ninety-eight per cent of the transport in Hammerfest port was liquid bulk. Hammerfest port is not included in the calculations in comparisons between earlier periods.
Increase in total amount of goods
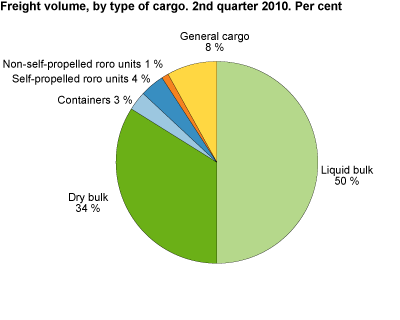
A total of 42.4 million tonnes of goods were transported in the 2n d quarter of 2010. The figures show that 67 per cent of all goods were sent to or from a foreign port. In the same period in 2009, the share was 62 per cent. The type of cargo liquid bulk and dry bulk constituted 49 and 36 per cent respectively of all goods in the 2n d quarter of 2010. Figures for the same period of 2009 were 56 and 29 per cent respectively.
Highest increase in dry bulk
During the 2n d quarter of 2010,15.1 million tonnes of dry bulk were transported. This was an increase of 3.8 million tonnes compared with the same period in 2009. The largest dry bulk ports were Narvik and Grenland ports, with an increase of 1.6 and 0.5 million tonnes respectively compared to the 2n d quarter 2009. Two thirds of dry bulk was transported to or from Norwegian ports.
Increase of container transport
There was an increase in the 2n d quarter of 2010 of the cargo and number of TEU containers. A total of 1.2 million tonnes of cargo were transported; an increase of 15.8 per cent compared to the 2n d quarter of 2009. A total of 164 400 TEU containers with and without cargo were transported. This was 22 600 or 15.9 per cent more compared to the same period in 2009. Oslo port was the largest container port, with a total of 38 000 TEU containers.
Less liquid bulk
In the 2n d quarter of 2010, 20.6 million tonnes of liquid bulk were transported. In the same period in 2009, the figure was 21.7 million tonnes; a decrease of 4.9 per cent. The largest liquid bulk port was Bergen and Omland port, with a decrease of 1.4 million tonnes compared to the 2n d quarter of 2009.
Total transport of liquid bulk including Hammerfest port was 21.7 million tonnes in the 2nd quarter of 2010.
Slight decrease for international ferries
A total of 1 477 000 passengers travelled with the international ferries to and from Norwegian ports in the 2n d quarter of 2010. In the same period in 2009, the figure was 1 483 0000 passengers. Kristiansand port had an increase of 24 000 passengers, and an increase of cars, motorcycles and accompanying trailers/caravans of 12 400 units. The others ports were almost unchanged.
More passengers with the Coastal Express Liner
In the 2n d quarter of 2010, 6 300 more passengers, or 4.9 per cent, travelled with the Coastal Express Liner compared with the 2n d quarter of 2009. A total of 136 500 passengers travelled with the route in the 2n d quarter of 2010. During the first half of 2010, 214 000 travelled with the Coastal Express Liner.
Liquid bulk and dry bulkLiquid bulk includes oil and other liquid products. Dry bulk includes grains/cereals, coal, iron ore and other non-liquid products |
TEU containerTwenty-foot Equivalent Unit container |
Tables:
- Table 1 Maritime transport statistics. Cargo in domestic and international traffic, by port district. 2nd quarter 2010. Tonnes
- Table 2 Maritime transport statistics. Cargo, by port district. 2nd quarter 2010. Tonnes
- Table 3 Maritime transport statistics. Number of containers TEU (by lolo and roro) and cargo, by port district. 2nd quarter 2010. Tonnes
- Table 4 Maritime transport statistics. Number of passengers and vehicles in ferry transport, by port district. 2nd quarter 2010
- Table 5 Maritime transport statistics. Arrivals of vessels, by type of vessel. 2nd quarter 2010
- Table 6 Express Coastal Liner Bergen-Kirkenes, 2nd quarter 2010. The number of passengers
Contact
-
Liv Torunn Petersen
E-mail: liv.torunn.petersen@ssb.no
tel.: (+47) 40 81 13 82
-
Sjøtransport
E-mail: sjotransport@ssb.no
-
Henrik Eli Almaas
E-mail: henrik.almaas@ssb.no
tel.: (+47) 97 78 89 27

