Content
Published:
This is an archived release.
Increased transport in the ports
From the largest Norwegian ports, an increase of 2.1 million tonnes more cargo was transported in the 4th quarter of 2011 than in the 4th quarter of 2010.
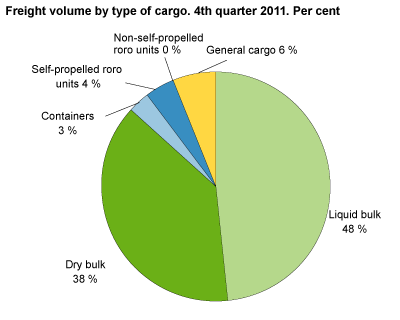
In total, the transport of cargo was 46.1 million tonnes in the 4th quarter of 2011, or 66 per cent of the total amount transported to and from a foreign port.
More dry and liquid bulk
The transport of dry bulk had an increase of 13.8 per cent, to 17.4 million tonnes, compared to the same quarter in 2010. Narvik port was the largest port of dry bulk with 4.5 million tonnes, which is mainly made up of iron ore. This was a decrease of 8.0 per cent. In the same period, liquid bulk had an increase of 2.9 per cent to 22.3 million tonnes. The largest port with liquid bulk was Bergen port with 11.4 million tonnes; an increase of 9.6 per cent.
Stable containers traffic
In total, 177 000 TEU containers with and without cargo were transported in the 4th quarter of 2011, and 123 000 containers were loaded with cargo. This is an increase of 13 000 or 11.9 per cent compared to the 4th quarter of 2010. The cargo in TEU containers was 1.4 million tonnes; an increase of 12.1 in the same period.
Unchanged passenger traffic with international ferries
During the 4th quarter of 2011, 1.1 million passengers travelled with the international ferries. Compared to the same period in 2010, the number of passengers was unchanged. Oslo port had an increase in traffic of 36 500 passengers.
Fewer passengers with the Coastal Express Liner
In the last quarter of 2011, 62 300 passengers travelled with the Coastal Express Liner. This was 8 400 passengers, or 12.0 per cent less compared to the same period of 2010. Every 3 months had a decrease. Throughout 2010, 449 400 passengers travelled with the Coastal Express Liner. This was an increase of 9.1 per cent from 2010.
Liquid bulk and dry bulkLiquid bulk includes oil and other liquid products. Dry bulk includes grains/cereals, coal, iron ore and other non liquid products. |
TEU containerTwenty-foot Equivalent Unit container |
New PortStore Norske Spitsbergen Grubekompani AS - newcomer in 2011 |
Tables:
- Table 1 Maritime transport statistics. Cargo in domestic and international traffic, by port district. 4th quarter 2011. Tonnes
- Table 2 Maritime transport statistics. Cargo by port district. 4th quarter 2011. Tonnes
- Table 3 Maritime transport statistics. Number of containers TEU (by lolo and roro) and cargo, by port district. 4th quarter 2011. Tonnes
- Table 4 Maritime transport statistics. Number of passengers and vehicles in ferry transport, by port district. 4th quarter 2011
- Table 6 Express Coastal Liner Bergen-Kirkenes, 4th quarter 2011. The number of passengers
Contact
-
Liv Torunn Petersen
E-mail: liv.torunn.petersen@ssb.no
tel.: (+47) 40 81 13 82
-
Sjøtransport
E-mail: sjotransport@ssb.no
-
Henrik Eli Almaas
E-mail: henrik.almaas@ssb.no
tel.: (+47) 97 78 89 27

