Content
Published:
This is an archived release.
Less cargo in Norwegian ports
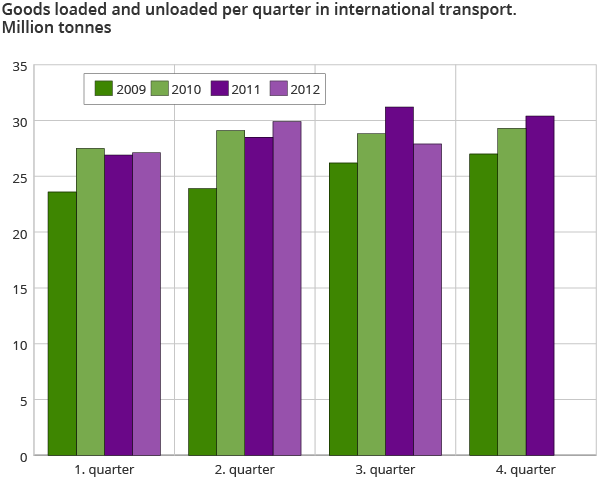
The transport of cargo to and from the largest Norwegian ports had a decrease of 4.2 per cent in the 3rd quarter of 2012 compared with the same quarter in 2011.
| 3rd quarter 2012 | ||
|---|---|---|
| Cargo (tonnes) | Share | |
| All ports | 45 646 390 | 100.0 |
| Selected ports | ||
| Oslo Port Authority | 1 388 078 | 3.0 |
| Grenland Port Authority | 2 699 666 | 5.9 |
| Kristiansand Port Authority | 433 736 | 1.0 |
| Stavanger Inter-Municipal Port Authority | 952 068 | 2.1 |
| Karmsund Inter Municipal Port Authority | 2 643 974 | 5.8 |
| Bergen and Omland Port Authority | 12 207 549 | 26.7 |
| Ålesund region's Port Authority | 401 728 | 0.9 |
| Trondheimsfjord Inter Municipal Port Authority | 541 833 | 1.2 |
| Bodø Port Authority | 413 932 | 0.9 |
| Tromsø Port Authority | 324 568 | 0.7 |
The total amount of goods transported by sea to and from the largest Norwegian ports was 45.6 million tonnes. Liquid bulk and dry bulk constituted the majority of the transport, with 46 and 41 per cent respectively.
Increased container traffic
A total of 178 200 TEU containers were transported in the 3rd quarter of 2012. A total of 117 700 were loaded; an increase of 1 100, or 0.9 per cent compared with the 3rd quarter in 2011. The cargo in containers increased by 2.9 per cent to 1.3 million tonnes in the same period. Of the total container traffic, Oslo port was largest, with 29.3 per cent of all container traffic.
Slight increase in dry bulk
The transport of dry bulk had an increase of nearly half a million tonnes from the 3rd quarter of 2011 to 18.9 million tonnes in the 3rd quarter of 2012. Narvik port was responsible for 25 per cent of all transported dry bulk, which is mainly made up of iron ore.
Less liquid bulk
In the 3rd quarter of 2012, a total of 20.8 million tonnes of liquid bulk were transported. This was a decrease of 2.1 million, or 9.2 per cent, compared to the same quarter of 2011. Bergen and Omland port represented half of the transported liquid bulk. Both of the largest ports with liquid bulk in Norway; Bergen and Omland port and Tønsberg port, had a decrease in the transport of liquid bulk.
Slight increase with the international ferries
The number of passengers travelling with international ferries to and from Norwegian ports in the 3rd quarter of 2012 totalled 2.1 million. This was an increase of 12 700 passengers or 0.6 per cent compared to the same quarter in 2011. The largest increase was at Larvik, with 23 500 passengers, or 8.1 per cent. The largest decrease was at Sandefjord, with 51 000 passengers, or 12.0 per cent. The transport of cars, motorcycles and accompanying trailers/caravans to and from Oslo, Kristiansand and Stavanger was 266 000, which corresponds to an increase of 7 per cent compared to the same quarter in 2011.
Fewer taking the Coastal Express Liner
A total of 148 500 passengers travelled on the Coastal Express Liner in the 3rd quarter of 2012.This was a decrease of 21 300, or 12.5 per cent compared to the 3rd quarter of 2011. Every month in the 3rd quarter of 2012 had a decrease. The largest decrease was 16.9 per cent in August, and the smallest decline was in September, with 7.3 per cent. A total of 76 000 passengers, or 51.1 per cent, travelled with the northbound route.
Contact
-
Liv Torunn Petersen
E-mail: liv.torunn.petersen@ssb.no
tel.: (+47) 40 81 13 82
-
Sjøtransport
E-mail: sjotransport@ssb.no
-
Henrik Eli Almaas
E-mail: henrik.almaas@ssb.no
tel.: (+47) 97 78 89 27

