Content
Published:
This is an archived release.
More cargo in Norwegian ports
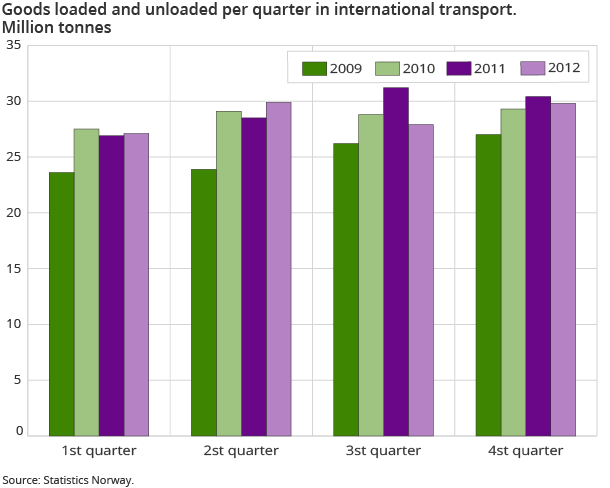
A total of 47.1 million tonnes of goods were transported to and from the largest Norwegian ports in the 4th quarter of 2012. This was almost 1 million tonnes, or 2.1 per cent more, compared to the 4th quarter of 2011.
| 4th quarter 2012 | ||
|---|---|---|
| Cargo (tonnes) | Share | |
| All ports | 47 124 284 | 100.0 |
| Selected ports | ||
| Oslo Port Authority | 1 485 547 | 3.2 |
| Grenland Port Authority | 2 678 979 | 5.7 |
| Kristiansand Port Authority | 453 661 | 1.0 |
| Stavanger Inter-Municipal Port Authority | 1 345 674 | 2.9 |
| Karmsund Inter Municipal Port Authority | 2 950 872 | 6.3 |
| Bergen and Omland Port Authority | 13 367 190 | 28.4 |
| Ålesund region's Port Authority | 543 185 | 1.2 |
| Trondheimsfjord Inter Municipal Port Authority | 490 710 | 1.0 |
| Bodø Port Authority | 258 797 | 0.5 |
| Tromsø Port Authority | 255 050 | 0.5 |
The total amount of goods transported by the sea to and from a Norwegian port was 63.3 million tonnes. At the same time in 2011, the amount accounted for 65.8 per cent. Liquid and dry bulk constituted the majority of the transport.
Slight increase in liquid bulk
The transport of liquid bulk had a slight increase of 0.5 per cent, to 22.4 million tonnes in the last quarter of 2012, compared with the same quarter in 2011. During the 4th quarter of 2012, 12.1 million tonnes of liquid bulk were transported in Bergen and Omland port, an increase of 6.5 per cent compared to the 4th quarter of 2011. This was 54 per cent of the total amount of liquid bulk. Tønsberg port had an increase of 14.1 per cent in the same period.
More containers
A total of 185 400 TEU containers with and without cargo were transported in the 4th quarter of 2012, an increase of 4.6 per cent compared with the 4th quarter of 2011. The total amount of containers with cargo was 57 300, an increase of 5 200 containers. The cargo of goods was about 1.4 million tonnes, unchanged compared to the same period in 2011.
Decrease in dry bulk
A total of 16.2 million tonnes of dry bulk were transported in the 4th quarter of 2012, a decrease of 7 per cent compared to the 4th quarter of 2011. Dry bulk accounted for 34.4 per cent of total carried transport. The amount in the same quarter in 2011 was 37.8 per cent. Narvik port had an increase of 28.5 per cent dry bulk in the same period, which was mainly made up of ore.
Less traffic with the international ferries
During the 4th quarter of 2012, 1.1 million passengers travelled with the international ferries. This was a decrease of 31 800, or 2.9 per cent, compared to the same period in 2011. Larvik and Sandefjord ports had a total decrease of 47 500 passengers. Kristiansand and Bergen ports had an increase in the number of passengers, with 16 000 and 1 500 passengers respectively. The transport of cars, motorcycles and accompanying trailers/caravans to and from all ports accounted for 180 500, a decrease of 3 750, or 2.0 per cent, compared to the 4th quarter of 2011.
More travellers with the Coastal Express Liner
A total of 72 250 passengers travelled on the Coastal Express Liner in the 4th quarter of 2012, which was an increase of 10 000, or 16.0 per cent, compared to the same quarter in 2011.The largest increase was 4 800 passengers or 27.6 per cent in November. Most passengers travel with the northbound route, and this amounted to 56 per cent of all passengers in the 4th quarter of 2012. Throughout 2012, 439 500 passengers travelled with the Coastal Express Liner. This was a decrease of 2.4 per cent from 2011.
Contact
-
Liv Torunn Petersen
E-mail: liv.torunn.petersen@ssb.no
tel.: (+47) 40 81 13 82
-
Sjøtransport
E-mail: sjotransport@ssb.no
-
Henrik Eli Almaas
E-mail: henrik.almaas@ssb.no
tel.: (+47) 97 78 89 27

