Content
Published:
This is an archived release.
Sharp drop in sea transport
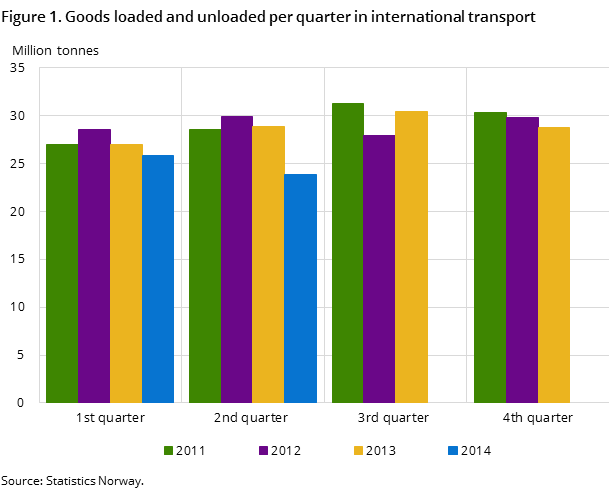
In the 2nd quarter of 2014, 41 million tonnes of cargo were handled in the largest Norwegian ports. This was a decrease of 13 per cent compared to the same quarter of 2013. The decrease was largest in liquid bulk.
| 2nd quarter 2014 | ||
|---|---|---|
| Cargo (tonnes) | Share | |
| All ports | 40 649 695 | 100.0 |
| Selected ports | ||
| Oslo Port Authority | 1 466 414 | 3.6 |
| Grenland Port Authority | 2 766 492 | 6.8 |
| Kristiansand Port Authority | 441 079 | 1.1 |
| Stavanger Inter-Municipal Port Authority | 1 641 864 | 4.0 |
| Karmsund Inter Municipal Port Authority | 839 761 | 2.1 |
| Bergen and Omland Port Authority | 9 353 030 | 23.0 |
| Ålesund region's Port Authority | 376 855 | 0.9 |
| Trondheimsfjord Inter Municipal Port Authority | 1 055 969 | 2.6 |
| Bodø Port Authority | 116 882 | 0.3 |
| Narvik Port Authority | 4 942 203 | 12.2 |
| Tromsø Port Authority | 166 429 | 0.4 |

The handling of liquid bulk had a decrease of 6.2 million tonnes, or 27.5 per cent, compared to the 2nd quarter of 2013. The total amount of cargo handled in Bergen and Omland port authorities had a decrease of 32.9 per cent and the transport of crude oil was halved in the same period.
More dry bulk and more container goods
In total, 18.2 million tonnes of dry bulk were transported in the 2nd quarter of 2014; an increase of 4.6 per cent from the 2nd quarter of 2013. Narvik port had an increase in ore of 9.4 per cent, to 4.9 million tonnes in the same period. A total of 1.4 million tonnes of cargo were transported in TEU containers during the 2nd quarter of 2014. In the same quarter in 2013, 1.3 million tonnes of cargo were transported. This represents an increase of 10 per cent. The number of empty containers had a reduction of 4 000 units, while containers with cargo had an increase of 1 000 units.
Increased traffic with international ferries
A total of 1.5 million passengers travelled with international ferries in the 2nd quarter of 2014. This was an increase of 131 600 passengers, or 9.5 per cent, compared to the 2nd quarter of 2013. The transport of cars, motorcycles and accompanying trailers/caravans had an increase of 9.5 per cent to 327 600 units, while the transport of buses had a decrease of 4 000 in the same period. In addition to the two other ferries that are already operating on the route between Sandefjord and Strømstad, a third vessel was in operation from June 2014.
Smaller increase in Coastal Express Liner traffic
In the 2nd quarter of 2014, 98 700 passengers travelled with the Coastal Express Liner. This was an increase of 700, or 0.7 per cent more than in the same quarter of 2013. The months of April and June had an increase in traffic compared to the 2nd quarter of 2013, by 1 600 and 550 passengers receptively. May had a decrease of almost 1 500 passengers in the same period. During the first half of 2014, 161 600 passengers travelled with the Coastal Express Liner.
Contact
-
Liv Torunn Petersen
E-mail: liv.torunn.petersen@ssb.no
tel.: (+47) 40 81 13 82
-
Sjøtransport
E-mail: sjotransport@ssb.no
-
Henrik Eli Almaas
E-mail: henrik.almaas@ssb.no
tel.: (+47) 97 78 89 27
