Content
Published:
This is an archived release.
Decrease in cargo by sea
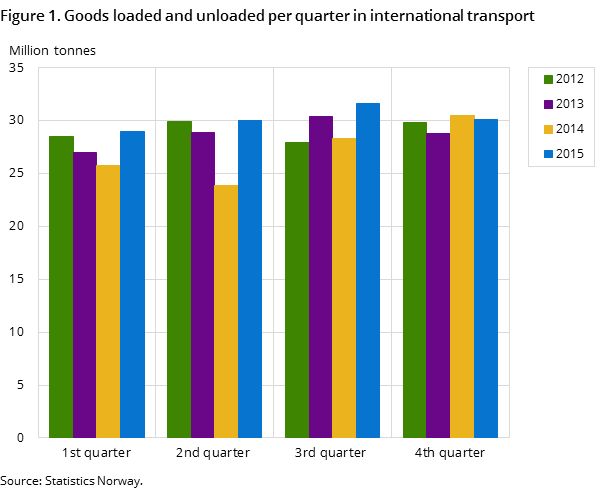
During the 4th quarter of 2015, 45.2 million tonnes of cargo were transported to or from the largest ports in Norway. This was a decrease of 3.8 million, or 7.8 per cent less than in the same quarter of 2014.
| 4th quarter 2015 | Share | |
|---|---|---|
| All ports | 45 197 433 | 100.0 |
| Oslo | 1 508 463 | 3.3 |
| Grenland Port Authority | 2 931 583 | 6.5 |
| Kristiansand | 430 702 | 1.0 |
| Stavanger | 513 673 | 1.1 |
| Karmsund | 3 176 970 | 7.0 |
| Bergen | 9 057 076 | 20.0 |
| Ålesund | 445 244 | 1.0 |
| Trondheim | 1 082 588 | 2.4 |
| Bodø | 150 533 | 0.3 |
| Narvik | 4 886 454 | 10.8 |
| Tromsø | 208 880 | 0.5 |

The main types of cargo, liquid and dry bulk, had an overall decrease of 2 million tonnes in the 4th quarter of 2015 compared to the same period of 2014. The transport of dry bulk had a decrease of 1.2 million tonnes, or 6.3 per cent. Narvik port, the largest port for dry bulk, had a decrease of 6.6 per cent, which mainly related to ore. The port of Grenland had an increase of 12.4 per cent.
During the last quarter of 2015, 22.2 million tonnes of liquid bulk was transported. This was a decrease of 0.7 million tonnes, or 3.0 per cent less than the same period in 2014. Bergen and Omland Port Authority had a decrease in this type of cargo of 11.5 per cent to 8.2 million tonnes.
Less container traffic
A total of 1.5 million tonnes of cargo in containers was transported in the 4th quarter of 2015, a decrease of 9.3 per cent compared to the 4th quarter of 2014. In total, 183 000 containers were transported with or without cargo. This was a decrease of 15 000 compared to the previous year. The number of loaded containers was almost 124 000, with 11.9 tonnes per container.
Less traffic with the international ferries
A total of 14 500 fewer passengers travelled on international ferries to or from abroad in the 4th quarter of 2015 compared to the 4th quarter of 2014. During the same period, 10 000 cars, motorcycles and accompanying trailers/caravans were transported on international ferries. A total of 1.2 million passengers travelled with these ferries in the 4th quarter of 2015.
More travellers with the Coastal Express Liner
In the 4th quarter of 2015, 63 000 passengers travelled with the Coastal Express Liner. This was an increase of 4 400 or 7.5 per cent compared to the same quarter in 2014. There was an increase in the traffic during all months in the last quarter of 2015. A total of almost 383 000 passengers travelled with this route, while 352 000 passengers travelled with this route in 2014; an increase of 31 000 or 8.8 per cent.
Adjusted extend Open and readClose
Starting from the 1st quarter of 2015, the cargo type Roll-on Roll-off (road goods vehicles and accompanying trailers) is not included in the statistics. This change has little effect on the comparability between previous quarters at an aggregated level, since only a few ports were affected.
On a more detailed level, the effects on comparability are somewhat greater.
Contact
-
Liv Torunn Petersen
E-mail: liv.torunn.petersen@ssb.no
tel.: (+47) 40 81 13 82
-
Sjøtransport
E-mail: sjotransport@ssb.no
-
Henrik Eli Almaas
E-mail: henrik.almaas@ssb.no
tel.: (+47) 97 78 89 27
