Content
Published:
This is an archived release.
Increase in tonne kilometres
The total transport performance increased by 8.3 per cent compared with the second quarter of 2000, and is now 3 423.3 tonne-kilometres. During the first six months the corresponding growth rate was 4 per cent. The total amount of goods transported in Norway during the second quarter of 2001 was 57.6 million tonnes. This is an increase of 1.4 per cent since the same period last year.
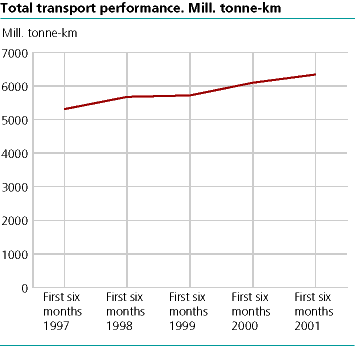
The total transport performance in the first six months has increased every year since 1997. Between 1997 and 2001 tonne kilometres increased by 19.4 per cent, from 5 311.8 to 6343.2 million tonne kilometres. Transport for hire or reward represented 82.4 per cent or 2821.2 million tonne kilometres of the total transport performance. This share decreased by 0.6 percentage points since the second quarter of 2000.
Share of goods on long hauls increasing
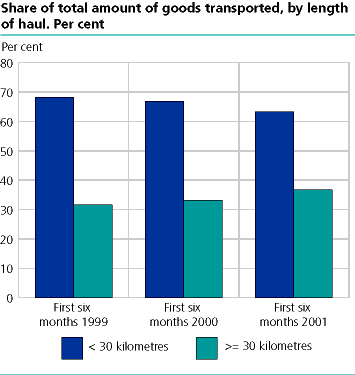
The total amount of goods transported more than 30 kilometres constituted 36.7 per cent of the total amount of goods transported during the first six months of 2001. This is an increase of 5 percentage points since 1999.
The movement of gravel, sand, cement, soil and stone fell by 1.2 million tonnes from the first six months of 2000 to the same period this year. Still these commodities, as a proportion of all goods moved, increased by 0.5 percentage points during the same period.
Rate of empty kilometres decreasing
In the second quarter of 2001, the total distance travelled by lorry was 359 million kilometres. This was an increase of 3.1 per cent since the same period last year. A total of 94 million kilometres were driven without cargo during the second quarter of 2001, which results in a rate of empty kilometres of 26.2 per cent. The corresponding rate in the second quarter of 2000 was 28.7 per cent.
The total utilisation of capacity has gone down by 4.8 percentage points, and in the second quarter of 2001 this rate was 45.8 per cent. The share of kilometres driven with cargo has decreased from 64.2 per cent to 60.5 per cent since the second quarter of 2000.
Tables:
- Table 1 Transport performances. Quarter
- Table 2 Tonnage carried, by group of vehicle. Quarter. Million tonnes
- Table 3 Transport performances, by group of vehicle. Quarter. Mill. tonne-kms
- Table 4 Tonnage carried, by length of journey. Quarter. Mill. tonnes
- Table 5 Transport performances, by length of journey. Quarter. Mill. tonne-kms
- Table 6 Tonnage carried, by commodity. Quarter. Mill. tonnes
- Table 7 Transport performances, by commodity. Quarter. Mill. tonne-kms
The statistics is now published as Carriage of goods by lorry.
Contact
-
Statistics Norway's Information Centre
E-mail: informasjon@ssb.no
tel.: (+47) 21 09 46 42


