Content
Published:
This is an archived release.
Growth in transport performance
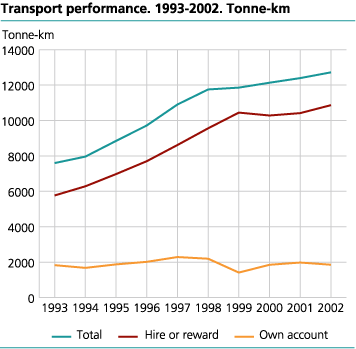
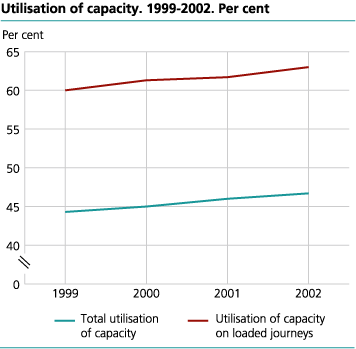
In 2002 the transport performance constituted 12.7 billion tonne-kilometres. This is an increase of 2.6 per cent from the previous year. The amount of goods transported went down from 215.9 million tonnes in 2001 to 211.7 million tonnes in 2002. The total utilisation of capacity has shown an even increase during the last years, and ended up on 46.7 per cent last year.
The domestic transport performance - that is weight of load multiplied by distance travelled - has increased by 67 per cent since 1993. While the average annual growth from 1993 to 1998 was 9.1 per cent, this rate went down to 1.6 per cent in the period 1998 to 2002. Public haulage represented 85.4 per cent of the total transport performance in 2002. This share has increased from 75.9 per cent in 1993.
More goods on semi-trailers
Public haulage accounted for 69.9 per cent of the freight moved by road in 2002. The share of all goods lifted for public haulage has decreased from 71 per cent in 2001. The amount of goods transported on lorries with a carrying capacity of 3.5 tonnes or more has decreased both in absolute and relative terms. These lorries transported 61.1 per cent of the goods in 2002, a decrease from 65.4 per cent in 2001. On the other hand semi-trailers increased their share of all goods lifted from 15.3 per cent in 2001 to 18.2 per cent in last year, and transported 38.5 million tonnes of goods in 2002.
Better utilisation of capacity
The total utilisation of capacity for Norwegian lorries was 46.7 per cent in 2002. This share was 63.0 per cent on loaded journeys. The rate of empty kilometres has decreased from 31.4 per cent in 1993 to 26.1 per cent the last two years.
Average length of haul increasing
The average length of haul per tonne goods was 60.1 kilometres in 2002, an increase of 4.7 per cent or 2.7 kilometres since 2001. In 1993 the average length of haul was 43.1 kilometres. The increase in the average length of haul can partly explain why the transport performance is increasing in spite of the decrease in the amount of goods transported.
Main figures for the fourth quarter 2002
Norwegian lorries carried 56 million tonnes of goods in Norway during the fourth quarter of 2002. This is 1.3 per cent more than in the same quarter in 2001. On the other hand the transport performance rose by 5.8 per cent in the same period, and constituted 3 276 million tonne-kilometres in the fourth quarter of 2002. The utilisation of capacity on loaded journeys was 62.2 per cent. This is an increase of 0.8 percentage points from the same period in 2001. The rate of empty kilometres rose by 0.7 percentage points to 26.2 per cent from the fourth quarter in 2001 to the corresponding period in 2002.
Tables:
- Table 1 Transport performances. Quarter
- Table 2 Tonnage carried, by group of vehicle. Quarter. Million tonnes
- Table 3 Transport performances, by group of vehicle. Quarter. Million tonne-kms
- Table 4 Tonnage carried, by length of journey. Quarter. Million tonnes
- Table 5 Transport performances, by length of journey. Quarter. Million tonne-kms
- Table 6 Tonnage carried, by commodity. Quarter. Million tonnes
- Table 7 Transport performances, by commodity. Quarter. Million tonne-kms
The statistics is now published as Carriage of goods by lorry.
Contact
-
Statistics Norway's Information Centre
E-mail: informasjon@ssb.no
tel.: (+47) 21 09 46 42


