Content
Published:
This is an archived release.
Geographical differences
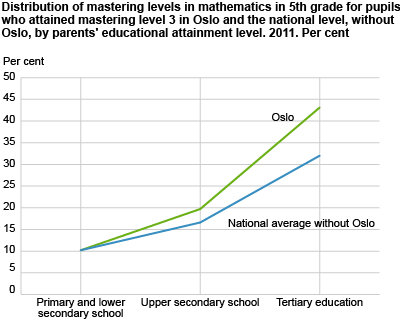
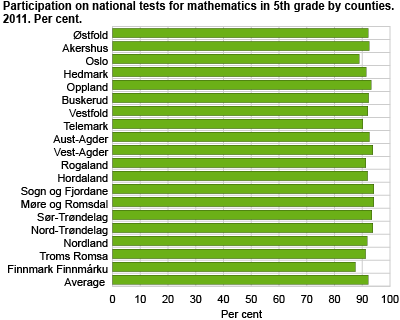
National tests held in 2011 once again show that the results differ among the counties. Pupils in Oslo and Akershus get the best results in the country. The level of participation in the different counties seems to be the same.
In Oslo and Akershus the pupils achieve higher results in all national tests. In Oslo, over 20 per cent of the pupils achieve the highest level in mathematics in 8th grade. In comparison, the national average is 12 per cent at this level. The pupils in Sogn- and Fjordane also have good results, but not as good as Oslo. These geographical differences are seen despite the level of participation apparently being the same for the different counties.
There is a difference of 18 percentage points between the counties with the highest and lowest shares of the lowest mastering level in mathematics in 5th grade. The best county here is Sogn and Fjordane with 22 per cent, while Finnmark has 40 per cent at this level. Finnmark, Nordland, Nord-Trøndelag and Østfold all have high shares of the lowest mastering levels in most of the tests. About one third of the pupils in these counties achieve the lowest mastering levels.
Further, there is a correlation between the results and living in a central municipality, with the pupils in the most central municipalities getting the best results. However, this is not the case for pupils whose parents do not have tertiary education. Therefore, the positive correlation seen between results and centrality seems to depend on the parental level of education, and not centrality alone.
Parents’ level of education has impact on results and improvement
As observed in previous years, there is a positive correlation between parental level of education and achieved test results. Pupils who have parents with tertiary education are more likely to achieve a high mastering level in all tests compared with other pupils. The national tests held in 2011 also imply that pupils whose parents have tertiary education are more likely to improve test results from 5th to 8th grade compared with other pupils.
Improvement in 9th grade
In the national tests in 2011, pupils in 8th grade and 9th grade were given the same tests in reading Norwegian and mathematics. A comparison between the test results of the two grades shows that pupils in 9th grade achieve higher results in both tests, most notably in reading Norwegian. Whereas one third of all pupils in 8th grade achieved a high level in reading Norwegian, half of all pupils in 9th grade did the same. The difference is greater for those who achieve the highest mastering levels, with no big change in evidence for those achieving the lowest mastering levels. This means that the differences between the best pupils and the pupils whose performance is poorer grow.
Gender differences
The boys continue to achieve better results in mathematics than the girls, while the opposite is the case in reading Norwegian. No gender differences are seen in English. The difference between the genders is greater in 8th grade than in 5th grade.
|
The results of the national tests are presented here as shares of the percentage at different mastering levels. The tests in 5th grade range from 1 to 3 (3 is highest), whereas the tests in 8th and 9th grades range from 1 to 5 (5 is highest). In order to make it easier to compare the results between the two different grades, a “low level” in 8th grade will, by definition, mean the same as mastering level 1 or 2, a “medium level” in 8th grade will mean 3, and a “high level” in 8th grade will mean 4 or 5. More detailed information about the levels and boundaries between levels is available in About the statistics . |
Tables:
- Table 1 Distribution of pupils by mastering levels in national tests in 5th grade, by parents' educational attainment level and the centrality of pupils' school municipality. 2011. Per cent
- Table 2 Distribution of pupils, by mastering levels in national tests in 8th grade, by parents' educational attainment level and the centrality of pupils' school municipality. 2011. Per cent
- Table 3 Distribution of pupils, by mastering levels in national tests in 5th grade, by gender and parents' educational attainment level. 2011. Per cent
- Table 4 Distribution of pupils, by mastering levels in national tests in 8th grade, by gender and parents' educational attainment level. 2011. Per cent
- Table 5 Distribution of pupils, by mastering levels in national tests in 5th grade, by gender and immigration category. 2011. Per cent
- Table 6 Distribution of pupils, by mastering levels in national tests in 8th grade, by gender and immigration category. 2011. Per cent
- Table 7 Distribution of pupils, by mastering levels in national tests in 8th grade, by parents' educational attainment level and the pupils' mastering level in 5th grade in 2008. 2011. Per cent
- Table 8 Distribution of pupils, by mastering levels in national tests in 8th grade and 9th grade. 2011. Per cent
The statistics is now published as Marks and national tests, lower secondary school.


