Content
Published:
This is an archived release.
Equal results in English
The English test has the most even results between pupils out of all the national tests. When making comparisons between the sexes, immigration categories or pupils from different social backgrounds, the results in English are fairly even. There are, however, greater variations in the pupils’ results in reading and mathematics.
| 2014 | |||
|---|---|---|---|
| Proportion of pupils who achieved the lowest level. English 5th grade | Proportion of pupils who achieved the lowest level. Reading 5th grade | Proportion of pupils who achieved the lowest level. Mathematics 5th grade | |
| All pupils | 24.8 | 23.2 | 24.6 |
| Sex | |||
| Boys | 25.1 | 25.9 | 23.4 |
| Girls | 24.5 | 20.5 | 25.9 |
| Immigration category | |||
| Immigrants | 27.4 | 40.7 | 36.5 |
| Norwegian-born to immigrant parents | 24.7 | 35.5 | 34.6 |
| Other pupils | 24.7 | 21.2 | 23.1 |
| Parents' educational attainment level | |||
| Parents do not have tertiary education | 32.5 | 33.4 | 35.1 |
| Parents have tertiary education | 19.5 | 15.9 | 17.1 |

The statistics on national tests and marks in lower secondary school normally show a positive correlation with school achievements and social background. The statistics also show that immigrants achieve lower results than other pupils, and that girls are likely to get better results than boys.
However, the results from the national tests in 2014 show that the pupils achieved more or less equal results in English, regardless of gender or immigration category. About 25 per cent of the pupils in 5th grade achieved the highest mastering level in English irrespective of immigration category and gender. However, pupils whose parents have tertiary education are more likely to achieve higher results compared with other pupils, but the distinction is still less in English than in reading and mathematics.
Immigrants achieve lower results in reading…
While pupils with different immigration backgrounds achieve more or less the same results in English on average, the variations in the results in reading and mathematics are much greater. There is, for instance, a difference of 8 score points between immigrants and other pupils in the reading test in 8th and 9th grade, and boys achieved lower results than girls. Almost 30 per cent of immigrant boys achieved the lowest mastering level in the reading test in 8th grade, while the corresponding figure for other boys was 19 per cent.
…but many immigrants are exempt from the reading test
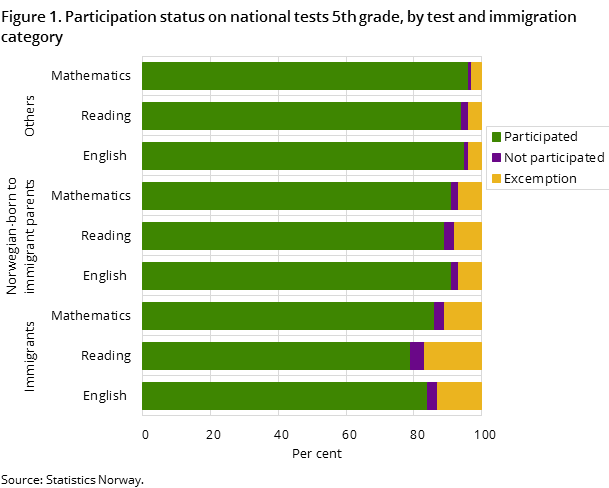
The exemption rate among immigrants is relatively high compared with other pupils, and it is especially high in reading. This is partly because many immigrant pupils receive additional language training, which along with special education can qualify as exemption from national tests. Figure 1 shows that 17 per cent of the immigrants in 5th grade were exempt from the reading test, while an additional 4 per cent did not show up for the test. In total, 5 per cent of the pupils were exempt from the reading test and 2.5 per cent did not show up for the test.
Country background has impact on the results
Norwegian-born to immigrant parents from EU/EEA, USA, Canada, Australia and New Zealand achieve higher results than the other pupils in all of the tests and in all the grades, and the disparity is greatest in English. While Norwegian-born to immigrant parents from EU/EEA etc. on average achieved 55 score points in English in 8th grade, the rest of the pupils got an average of 50 score points.
On the other hand, the figures show that both immigrants and Norwegian-born to immigrant parents from Asia, Africa, Latin America, Oceania except Australia and New Zealand, and Europe except EU/EEA achieved considerably lower results compared with the other pupils, and especially in reading. Immigrants from Asia, Africa etc. achieved on average 9 score points fewer than the other pupils in the reading test in 8th grade.
New scale for publication of results – score pointsOpen and readClose
From 2014, the results can be measured in points in addition to mastering levels. The average score point is set at 50, with the standard deviation 10. To create this scale, which reflects the pupils’ skills and results in the national tests, the methodology Item Response Theory (IRT) has been used. Accordingly, the pupils’ results have been converted into score points where the average was set at 50. More information about the new scale can be found in “About the statistics” or at the Norwegian Directorate for Education and Training.
Comparability over time in English and mathematics Open and readClose
Until 2013, the score intervals for each mastering level were set every year. From 2014 and onwards, the intervals for each level are definite for the tests in English and mathematics. This means that from 2014 and onwards, it will be possible to compare the results over time. In addition, from 2014, a representative population of six per cent of the pupils will be given so-called anchor items, which will serve to link the tests from year to year, and thus make it possible to compare the results over time. At the present stage, comparison over time will be possible from 2015 in English and mathematics.
The statistics is now published as Marks and national tests, lower secondary school.
