Content
Published:
This is an archived release.
Consistent disparities in national tests
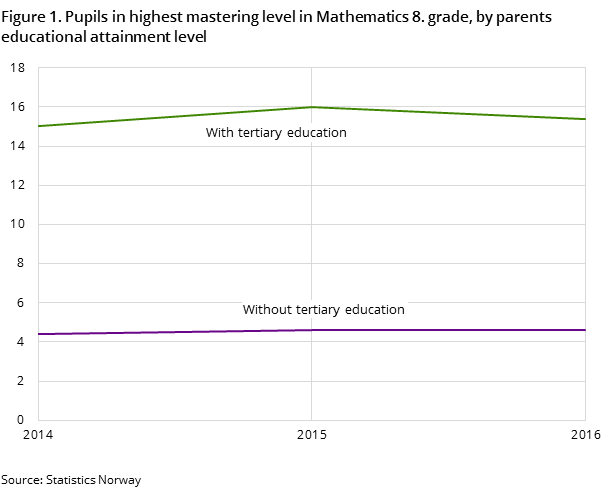
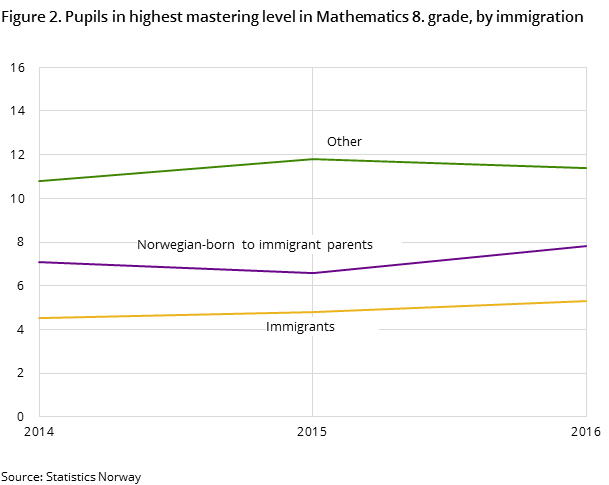
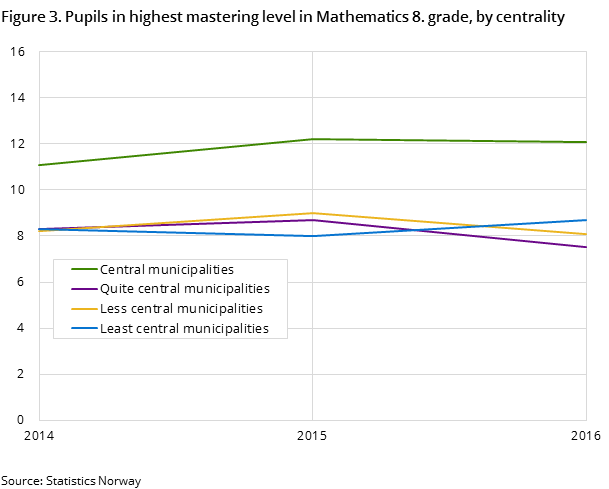
The results from Norwegian national tests show that the same groups are achieving the highest proficiency level year after year: pupils in central municipalities, pupils with highly educated parents and pupils with no immigration background are more likely to perform above the average level.
| 2016 | |||
|---|---|---|---|
| Proportion of pupils who achieved the lowest level. English 5th grade | Proportion of pupils who achieved the lowest level. Reading 5th grade | Proportion of pupils who achieved the lowest level. Mathematics 5th grade | |
| All pupils | 24.4 | 25.4 | 23.0 |
| Sex | |||
| Boys | 23.3 | 27.6 | 21.3 |
| Girls | 25.5 | 23.1 | 24.9 |
| Immigration category | |||
| Immigrants | 27.8 | 42.9 | 36.1 |
| Norwegian-born to immigrant parents | 22.5 | 35.5 | 33.4 |
| Other pupils | 24.3 | 23.3 | 21.2 |
| Parents' educational attainment level | |||
| Parents do not have tertiary education | 31.9 | 35.5 | 33.6 |
| Parents have tertiary education | 19.6 | 18.5 | 16.0 |


National tests were introduced in 2004, and Statistics Norway has results that are comparable from 2014. The statistics on marks in lower secondary school and in national tests normally show a positive correlation with school achievements and social background. The statistics also show that immigrants achieve lower results than other pupils.
Pupils in 5th grade are tested in reading, English and mathematics, and are measured on a scale of mastering levels from 1 to 3. Pupils in 8th grade are tested in the same subjects, but are measured on a scale from 1 to 5. In 9th grade, pupils get the same tests in reading and mathematics as 8th grade received the same year. This gives schools comparable results between pupils in different grades of the same year.
Parents’ education level leads to disparities
Regardless of tests and which grade the pupil is in, pupils with highly educated parents are overrepresented at levels above average. The English test has least disparities in performance between groups of pupils, but a clear correlation between parental education and the highest mastery level is also visible here, from as early as the 5th grade.
There is a small gender disparity in the results. Results from the years after score points were introduced shows that girls tend to perform better on the reading test, while boys have slightly better results in mathematics. Results from the English test are even in the 5th and 8th grades, while the greatest disparity is seen in the reading test in the 9th grade, in favour of girls.
Immigration background leads to disparities
The English test is also the one that produces least disparities between immigration categories. In 2016, 28 per cent of immigrant pupils in 5th grade achieved the highest level in English, while the corresponding percentage for other pupils was 24 per cent. Greater disparities were seen in the reading test in the same grade: while 12 per cent of immigrant pupils scored on the highest mastering level, 26 per cent of pupils without an immigrant background achieved the same result.
This pattern is visible across all the grades and years we examined. While the English test is somewhat more even, pupils without an immigrant background more often achieve a higher level in mathematics and reading. One group that stands out is the Norwegian-born pupils to immigrant parents from the EU/EEA, USA, Canada, Australia and New Zealand. This group is better represented in higher mastering levels than other Norwegian-born pupils to immigrant parents.
Where the pupil lives leads to disparities
Pupils from central municipalities are distinguished by their over-representation at the highest levels, regardless of test and grade. This does not mean that students perform poorer the less central they live. Centrality is divided into four categories, and students from the three categories below central municipalities are even in their performance in the reference time period.
New scale for publication of results – score pointsOpen and readClose
From 2014, the results can be measured in points in addition to mastering levels. The average score point is set at 50, with the standard deviation 10. To create this scale, which reflects the pupils’ skills and results in the national tests, the methodology Item Response Theory (IRT) has been used. Accordingly, the pupils’ results have been converted into score points where the average was set at 50. More information about the new scale can be found in “About the statistics” or at the Norwegian Directorate for Education and Training.
Comparability over timeOpen and readClose
Until 2013, the score intervals for each proficiency level were set every year. From 2014 and onwards, the intervals for each level are fixed for the tests in English and mathematics. This means that from 2014 and onwards, it will be possible to compare the results over time. In addition, from 2014, a representative population of six per cent of the pupils will be given so-called anchor items, which will serve to link the tests from year to year, and thus make it possible to compare the results over time. At the present stage, comparison over time will be possible from 2015 in English and mathematics. This will be added to the reading test from 2016, making it possible to compare results in reading over time from 2017 onwards.
The statistics is now published as Marks and national tests, lower secondary school.
