Content
Published:
This is an archived release.
Slight decline in foreign direct investments
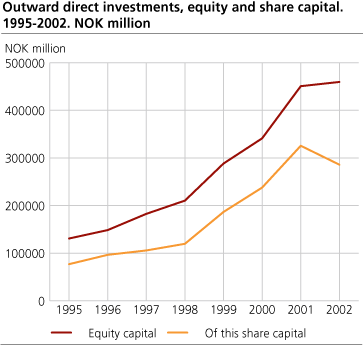
At the end of 2002, Norway's stock of foreign direct investment (FDI) amounted to NOK 474.4 billion, compared with NOK 481.3 billion in 2001. Around 60 per cent of the total outward direct investment went to EU countries. Enterprises involved in oil and gas exploration, manufacturing, mining and quarrying accounted for 67 per cent of the investments.
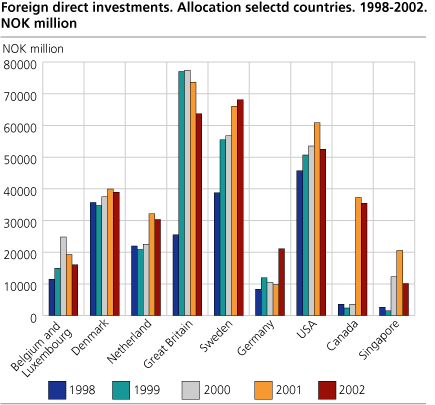
From 2001 to 2002 there was an increase in investments in Germany, Finland, Sweden and Australia, among others. However, because several companies in the USA and the UK in particular lost part of their equity in 2002, the Norwegian investments in these countries have fallen. This explains the majority of the change from 2001 to 2002. Until 2002 foreign investments by Norwegian companies were on the rise.
Norway's part of the share capital in foreign enterprises amounted to NOK 285.9 billion at the end of 2002, while other types of equity capital amounted to NOK 173.8 billion. Net claims stood at NOK 14.7 billion.
82 per cent of the outward direct investments were placed in European countries and North America, with the UK, the USA, Sweden, Denmark, Canada, the Netherlands and Germany and being the main destinations for Norwegian foreign investments.
The return on foreign direct investment is defined as investor's share of retained earnings, plus dividend payments and net interest income. In 2001, this amounted to NOK 12 billion.
The figures presented here are based on data from the Directorate of Taxes. The survey covers foreign enterprises in which a Norwegian investor has direct ownership of 10 per cent or more of the equity, or indirect ownership of 50 per cent or more. Since investments through the Government Petroleum Fund may not exceed 10 per cent of the share capital in any one company, such investments are not included here.
The figures represent the book values of the enterprises, which can be very different from the market values. The FDI statistics is a continuation of Norges Bank's statistics from 1988 to 2000 and replaces previous estimates for the years 1999, 2000 and 2001
Historical overview: http://www.norges-bank.no/front/statistikk/en/invnorskiutl/
Tables:
- Table 1 Foreign direct investments. 1998-2002. Total. NOK million
- Table 2 Foreign direct investments. Geographical distribution. 1998-2002. Total. NOK million
- Table 3 Foreign direct investments. Industrial distribution. 1998-2002. Total. NOK million
- Table 4 Return on outward direct investments. 1998-2002. Total. NOK million
The statistics is published with Foreign direct investment.
Contact
-
Statistics Norway's Information Centre
E-mail: informasjon@ssb.no
tel.: (+47) 21 09 46 42


