Content
Published:
This is an archived release.
High returns on investments abroad
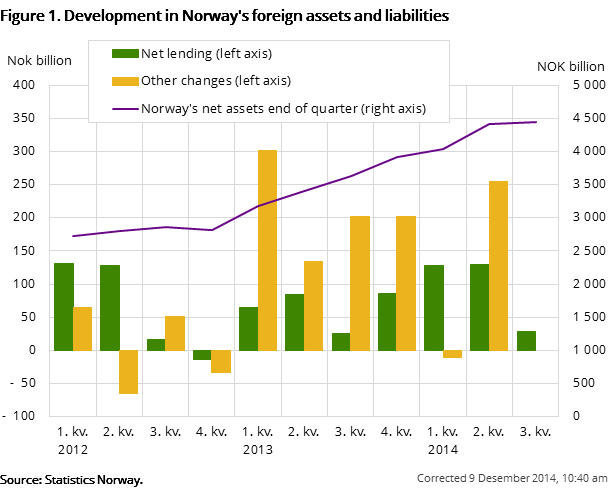
Norwegian net assets increased by NOK 1 716 billion from the 1st quarter of 2012 to the 3rd quarter of 2014. Investment in equities and debt securities abroad gave good returns.
| Opening balance | Transactions | Other changes | Closing balance | |
|---|---|---|---|---|
| Foreign assets | 10 294 499 | 81 673 | -2 238 | 10 373 934 |
| Direct investment | 1 729 032 | 9 599 | 3 166 | 1 741 797 |
| Portofolio investment | 6 837 393 | 35 760 | -20 356 | 6 852 797 |
| Other investments | 1 328 871 | 10 392 | 9 588 | 1 348 851 |
| Reserve assets (IMF breakdown) | 399 203 | 25 922 | 5 364 | 430 489 |
| Liabilities | 5 876 280 | 53 234 | -1 696 | 5 927 818 |
| Direct investment | 1 589 239 | 29 236 | 1 559 | 1 620 034 |
| Portofolio investment | 2 576 676 | 18 736 | -11 866 | 2 583 546 |
| Other investments | 1 710 365 | 5 262 | 8 611 | 1 724 238 |
| NET ASSETS | 4 418 219 | 28 439 | -542 | 4 446 116 |

This is the first publication with quarterly figures for Norway’s international investment position. New international guidelines from Eurostat and IMF are incorporated. The new guidelines aim to give a better understanding of the economic globalisation.
Large positions in portfolio assets
Norway’s net assets result from the Norwegian foreign assets subtracted from the Norwegian foreign liabilities. The increase in net assets in the period 1st quarter 2012 to 3rd quarter 2014 is largely due to large investments in portfolio assets. Direct investment and other investments have risen steadily in the period.
By the end of the 3rd quarter of 2014, Norwegian assets of portfolio investment amounted to NOK 6 853 billion. The general government (dominated by the Government Pension Fund Global) is the main reason for the large increase. The sector general government holds NOK 3 393 billion in equity positions, and NOK 2 074 billion in debt securities.
Norway’s assets in direct investments amounted to NOK 1 742 billion by the end of the 3rd quarter. The liabilities in direct investment amounted to NOK 1 620 billion.
Other investments’ liabilities were higher than the assets in the period 2012-2014. Norway’s liabilities were NOK 1 724 billion by the end of the 3rd quarter of 2014. Currency and deposits, which include foreigners’ deposits invested in Norway, amounted to NOK 927 billion.
Norges Bank's international reserves comprise of foreign exchange reserves’ assets and liabilities items related to the International Monetary Fund (IMF). These items are shown under international reserves’ assets and under other investments’ liabilities (special drawing rights). In the 3rd quarter of 2014, international reserves amounted to NOK 430 billion.
Net assets as a percentage of GDP
Norway’s net foreign assets as a percentage of GDP increased from 95 per cent at the end of the year 2012 to 128 per cent at the end of the year 2013.
The global equity market gave good returns
Changes in positions are due to transactions and other changes. The positions are influenced by changes in the global market, with its changes in exchange rates and equity prices. Figure 1 shows a large increase in “net other changes” for most of 2013 and in the 2nd quarter of 2014. The Government Pension Fund Global, included in the general government sector, had high returns in 2013. Strong equity markets gave high returns on the equity investments. Quarters with small or negative net other changes, such as the 2nd and 4th quarters of 2012 and the 1st and 3rd quarters of 2014, are mainly influenced by a decrease in the global equity market. Exchange rate changes also contribute.
Financial transactions
The transactions that are published in international investment position are the same as the financial transactions published in the balance of payments. In the 3rd quarter of 2014, the changes in net positions from the previous quarter amounted to NOK 28 billion, of which the transactions contributed to almost the complete change in positions.
RevisionsOpen and readClose
Statistics Norway has implemented the new international recommendations (IMFs Balance of Payments and international investment position Manual – BPM6).
The new recommendations in BPM6 have changes from the previous manual (BPM5) in the definition of direct investment and incorporation of the IMF’s liability for special drawing rights (SDR). Please see further information in “About the statistics”.
Closed time seriesOpen and readClose
Statistics Norway has previously published an annual publication of international investment position. The annual publication was based on BPM5, and the data have not been updated with the latest revision of data and not been implemented according to the new recommendations in BPM6. Time series from 1998-2012 are shown as closed series in Statbank.
Quarterly external debt is now covered by figures from the quarterly international investment positions, and a separate table is made to fulfill IMF requirements.
The statistics is now published as International accounts.
Contact
-
Statistics Norway's Information Centre
E-mail: informasjon@ssb.no
tel.: (+47) 21 09 46 42
