Content
Published:
This is an archived release.
Most Norwegian-controlled enterprises are in Europe
In 2015, Norwegian companies controlled 4 513 enterprises abroad, across 124 countries. These enterprises had a turnover of NOK 1 280 billion and employed 280 275 persons. Compared to 2015, this was a 4.9 per cent increase in turnover. Seventy per cent of Norwegian-controlled enterprises are located in Europe.
| 2015 | |||
|---|---|---|---|
| Enterprises | Turnover (NOK million) | Employed persons | |
| All countries | 4 513 | 1 279 956 | 280 275 |
| Europe | 3 144 | 734 689 | 164 762 |
| Africa | 110 | 49 236 | 4 358 |
| Asia | 636 | 178 784 | 54 993 |
| North and Central America | 413 | 218 899 | 32 128 |
| South America | 135 | 81 775 | 20 130 |
| Oceania | 75 | 16 572 | 3 904 |
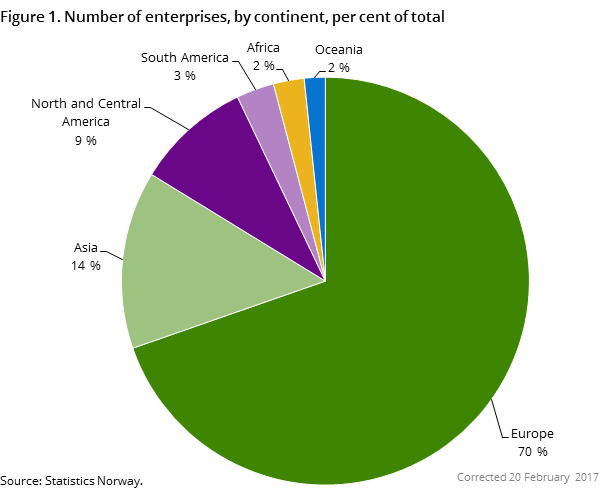
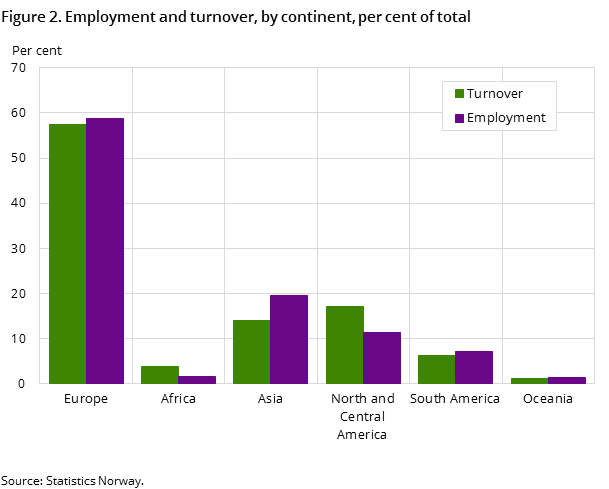
The geographical breakdown of Norwegian-controlled enterprises abroad is shown in figure 1. The illustration shows the importance of Europe with its 3 144 enterprises, making it the largest continent with 70 per cent of all enterprises. Following Europe, Asia and North and Central America account for 14 per cent and 9 per cent respectively. Figure 2 shows the distribution of employment and turnover by the same geographical area. Also here, Europe dominates with regards to employment and turnover, followed by Asia and North and Central America. The 2015 sample had 767 new enterprises, while the remaining 3 749 enterprises were also represented in the 2014 statistics.
Six countries had half of the turnover
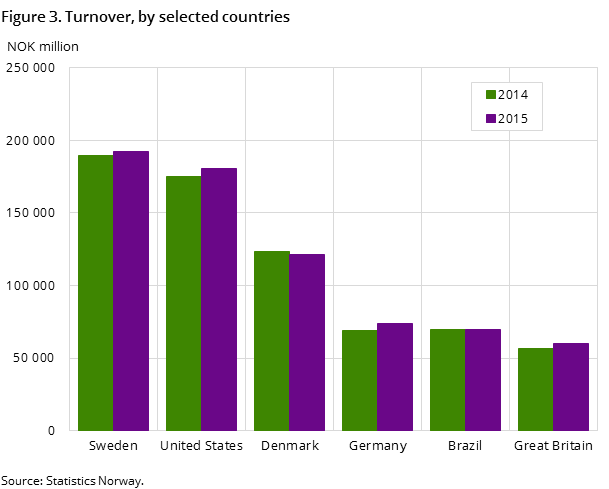
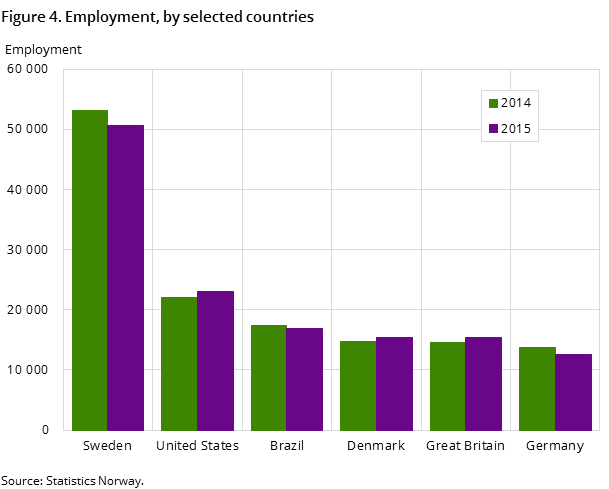
A few countries together account for more than half the turnover and almost half the employment in the world. These countries are shown in figures 3 and 4, with turnover and employment for 2014 and 2015. The two countries with the highest turnover were Sweden and the USA, followed by Denmark, Germany, Brazil and Great Britain. With regards to employment, Sweden and the USA remained the largest countries. With a slightly different order than for turnover, Brazil, Denmark, Great Britain and Germany followed.
Five enterprise groups account for over 50 per cent of the turnover
Furthermore, the sample of these statistics was dominated by a small number of big enterprise groups. In 2015, 5 out of 666 enterprise groups represented in the statistics had over 50 per cent of the total turnover obtained from the 379 enterprises abroad.
Most enterprises with ten or less employees
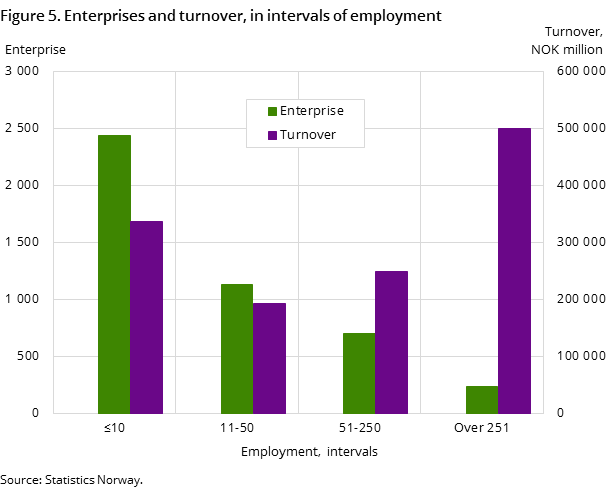
Figure 5 shows the turnover and number of enterprises grouped by number employed. The largest share of enterprises had ten or less people employed, and the number of enterprises declined with employment. Enterprises with more than 250 employees had a turnover of NOK 500 billion, representing the highest rate of turnover per enterprise.
RevisionOpen and readClose
2014 and 2015 are revised.
Contact
-
Marita Garvik Fagerheim
E-mail: marita.fagerheim@ssb.no
tel.: (+47) 93 03 29 48
-
Nanna Louise Børgund
E-mail: nanna.borgund@ssb.no
tel.: (+47) 90 47 24 93
